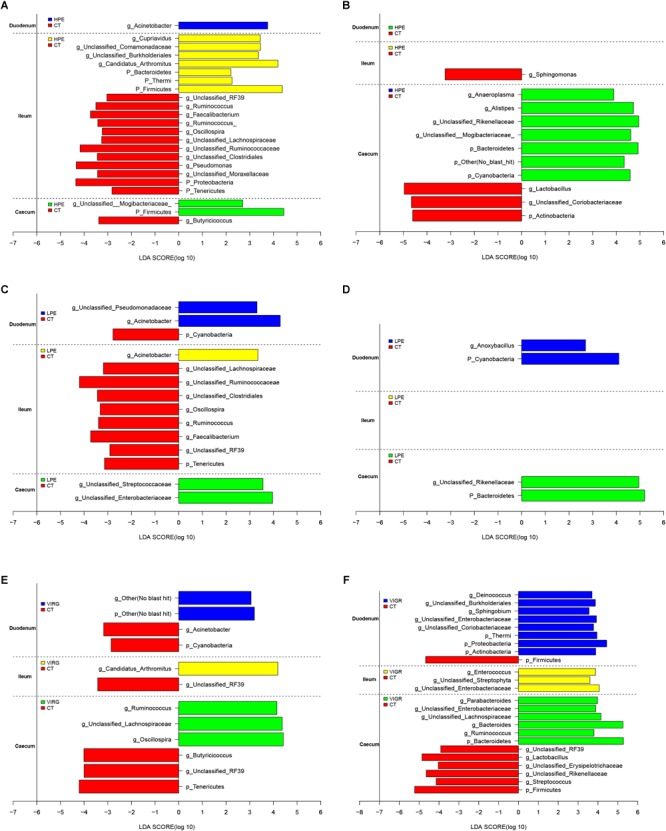
FIGURE 3.

Histograms showing the results of the linear discriminant analysis effect size (LEfSe) measurements, identifying the most differentially abundant phyla and genera between the PE/VIRG and CT groups. (A,B) Representation of the LEfSe results, showing different phyla and genera in the duodenum, ileum, and cecum samples from the HPE and CT chickens at day 14 and 28. (C,D) Representation of the LEfSe results, showing different phyla and genera in the duodenum, ileum, and cecum samples from the LPE and CT chickens at day 14 and 28. (E,F) Representation of the LEfSe results, showing different phyla and genera in the duodenum, ileum, and cecum samples from the VIRG and CT chickens at day 14 and 28. The CT chickens are indicated with a negative LDA scores (LDA > 2; P < 0.05). CT, basal diet (control); VIRG, basal diet supplemented with 30 mg/kg virginiamycin; LPE, basal diet supplemented with 200 mg/kg plant extracts; HPE, basal diet supplemented with 400 mg/kg plant extracts.
