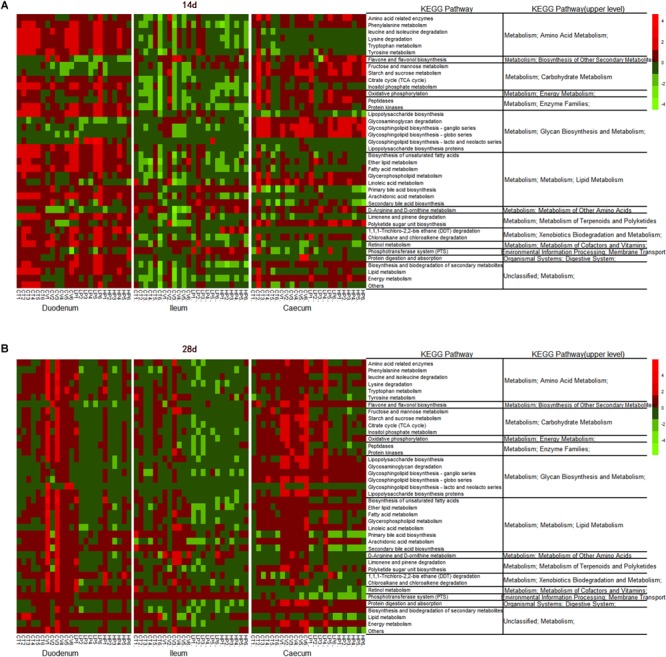
FIGURE 5.

Heatmap of relative abundance of predicted functional KEGG pathways of level 3 of the duodenal, ileal, and cecal microbiota of broilers on (A) day 14, and (B) day 28 by the LEfSe test (LDA > 2; P < 0.05). CT, basal diet (control); VIRG, basal diet supplemented with 30 mg/kg virginiamycin; LPE, basal diet supplemented with 200 mg/kg plant extracts; HPE, basal diet supplemented with 400 mg/kg plant extracts.
