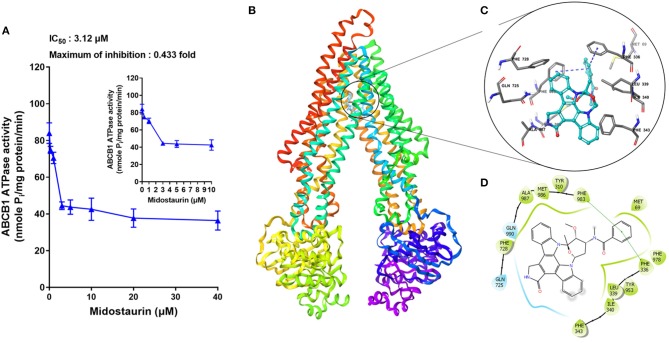
Figure 7.
The effects of midostaurin on the ATPase activity of ABCB1 and the molecular modeling study of midostaurin with human homology ABCB1. (A) Effect of midostaurin on the ATPase activity of ABCB1. The inset graphs illustrate the effect of 0–10 μM midostaurin on the ATPase activity of ABCB1. Data are mean, representative of three independent experiments. (B) Overall view of midostainrin-ABCB1 complex. (C) Docked position of midostaurin within the drug-binding site of human ABCB1 homology model by Glide docking. Midostaurin is shown as ball and stick mode with the atoms colored: carbon-cyan, hydrogen-white, nitrogen-blue, oxygen-red. Important residues are shown as sticks with gray color. π-π stacking interactions are indicated with blue dotted short line. (D) The two-dimensional ligand-receptor interaction diagram of midostaurin and human ABCB1. The amino acids within 3 Å are shown as colored bubbles, cyan indicates polar residues, and green indicates hydrophobic residues. The green short line shows π-π stacking interaction.

