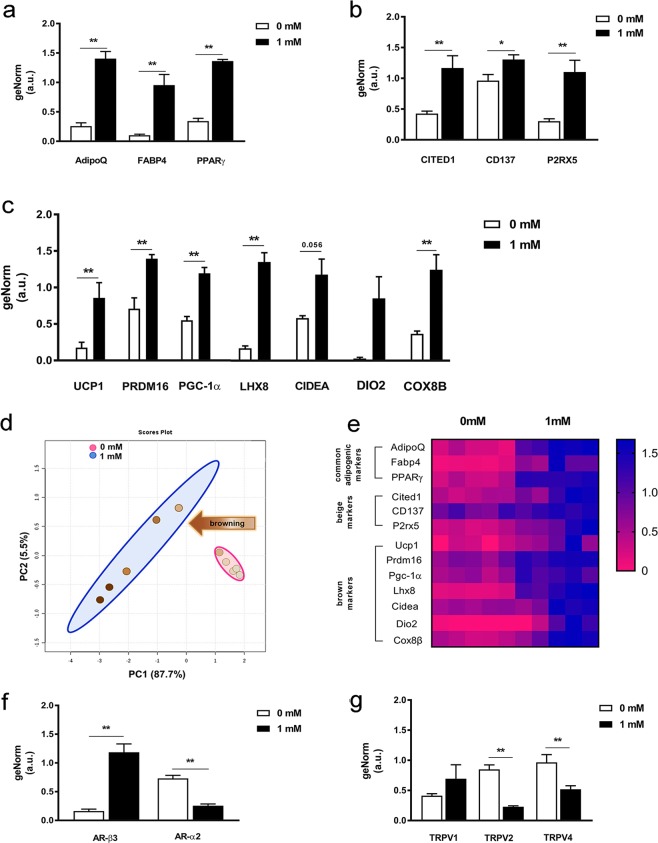
Figure 5.
Adipogenic gene expression analysis by qPCR during mMSCs differentiation treated with or without caffeine. Relative gene expression of (a) adipogenic markers AdipoQ, FABP4 and PPARγ, (b) beige lineage markers CITED1, CD137 and P2RX5, and (c) brown lineage markers UCP1, PRDM16, PGC-1α, LHX8, CIDEA, DIO2 and COX8b. (d) Scatter plot of the first two principal components, comprising 93.2% of total variance, highlighting two clusters corresponding to cells differentiated in adipogenic medium with 0 mM (pink) and 1 mM (blue) caffeine. (e) Unsupervised hierarchical clustering of expression values for the same genes and samples as those in panel D. Each row represents a gene while each column corresponds to a different sample. Gene expression of (f) AR-ß3 and AR-α2 and (g) TRPV1, TRPV2 and TRPV4. Data represent the mean ± SEM of five replicates; *P < 0.05; ***P < 0.001.

