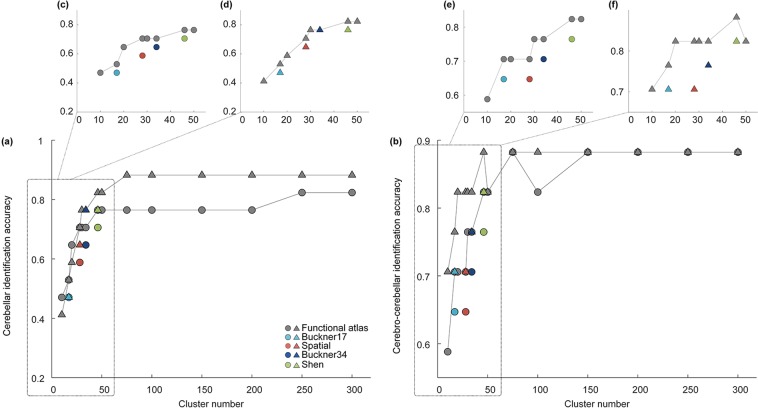
Figure 6.
Comparison of identification accuracy across two sessions in ‘validation’ group for our (gray symbol) and four existing atlases (Buckner’s 17 networks atlas - light blue, Buckner’s 34 networks atlas - dark blue, Spatial: the Spatially Unbiased Atlas Template - red, Shen: Shen’s functional parcellation - green) using (a) cerebellar functional connectivity or (b) cerebro-cerebellar functional connectivity for individual identification analyses. Symbols (circle or triangle) indicate when the first session or second session was used as the target set (with the other group serving as the database set).

