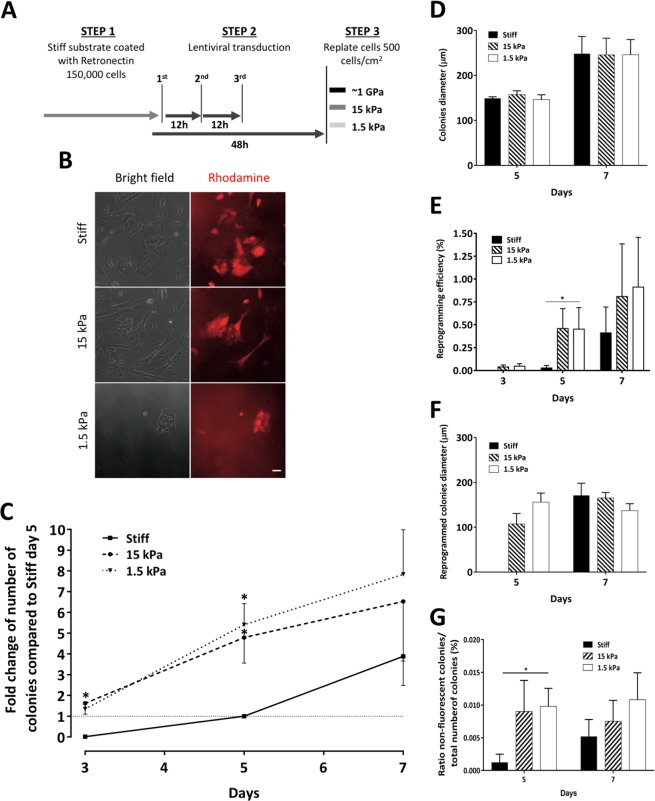
Figure 4.
Substrates with lower elastic modulus improved kinetics and efficiency of MSCs induced reprogramming. (A) Schematics of the reprogramming procedure. Cells were cultured on distinct substrates for 7 days (step 3). (B) Representative images of newly-formed iPSCs colonies in distinct substrates (day 5), scale bar corresponds to 50 μm. (C) Evaluating the reprogramming kinetics, each point represents the number of newly formed colonies, at the respective time point, normalized to the number of colonies on TCPs at day 5. Points represent mean ± SEM of 3 (days 3 and 7) or 4 (day 5) independent experiments. Colonies diameter is represented in (D), bars represent mean ± SEM of 3 independent experiments. The reprogramming efficiency can be observed in (E), bars represent mean ± SEM of 3 (day 3 and 7) or 4 (day 5) independent experiments. In (F) is represented the diameter of reprogrammed colonies, bars represent mean ± SEM of 3 independent experiments. (G) Ratio of reprogrammed colonies (non-fluorescent) per total number of newly-formed colonies. Statistical analysis was performed uisng Kruskal-Wallis test followed by Dunn’s multiple comparison test (*p < 0.05) in (C–G).

