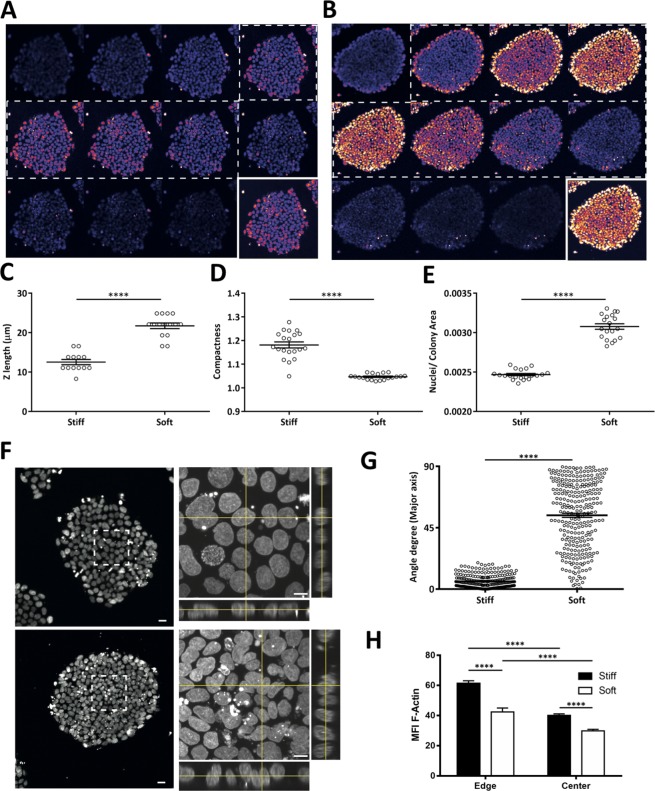
Figure 5.
Modulation of hiPSC colonies cultured on substrates with distinct stiffness. Representative Z-stack fluorescence microscopy images of DAPI-stained hiPSCs cultured on stiff (A) or soft PDMS (B) for 4 days. (C) Quantification of colonies height is presented by the mean ± SEM of at least 13 colonies. The colonies compactness (i.e. the mean squared distance of the object’s pixels from the centroid divided by the area — a filled circle will have a compactness of 1, with irregular objects, or objects with holes, having a value greater than 1) is presented in (D) and evidenced in (E). These quantifications are represented as mean ± SEM of at least 19 colonies. (F) Representative images of nuclei morphology from colonies cultured on stiff (upper panel) and soft (lower panel) substrates. Highlighted areas are magnified in the right panels, with Z-perspective of the nuclei. Scale bars correspond to 20 μm and 10 μm in low and higher magnification images, respectively. The nuclei projection in Z, given by the major axis, was quantified and presented in (G) as mean ± SEM from approximately 300 nuclei. (H) F-actin content in the center and the edge of colonies cultured on stiff or soft substrates, assessed by MFI quantification of at least 8 colonies, bars represent mean ± SEM. Statistical analysis was performed using two tailed t-test (****p < 0.0001) in (C,D,E,G), and two-way ANOVA followed by Sidak’s multiple comparison test (****p < 0.0001) in (H).

