Figure 3.
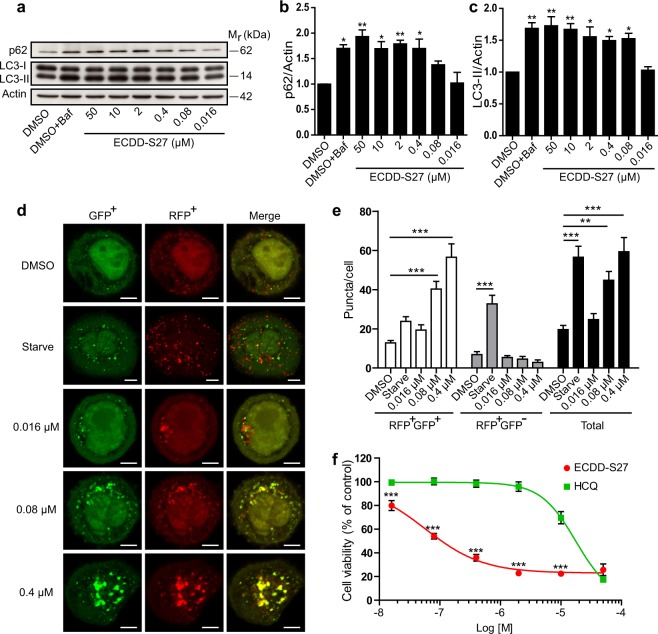
ECDD-S27 potently inhibits autophagic flux and restricts colorectal adenocarcinoma HT-29 cell survival. (a–c) Autophagic flux analysis in HT-29 cells by LC3-II and p62 immunoblots. Cells were treated with DMSO with or without bafilomycin A1 or ECDD-S27 at the indicated concentrations for 4 h. Representative images cropped from the same blot are shown and full images are included in the supplementary information. The intensities of LC3-II, p62, and Actin were quantified using ImageJ. The graphs showed densitometric analysis of p62/Actin and LC3-II/Actin expression levels. ECDD-S27 inhibits autophagic flux with the IC50 value of ≤0.016 µM. Data are mean ± SEM; *p < 0.05 and **p < 0.01, all relative to the DMSO control from three independent experiments, were determined by one-way ANOVA with a Tukey’s multiple comparison test. (d–e) RFP-GFP-LC3B puncta analysis confirmed ECDD-S27 autophagic flux inhibition. RFP-GFP-LC3B expressing HT-29 cells were treated with DMSO, starvation, or ECDD-S27 at the indicated concentrations for 4 h and processed for confocal microscopy. The number of LC3B puncta/cell was then analyzed. Only puncta ≥0.3 µm in size were counted. Data are the means ± SEM from at least three independent experiments. At least 30 cells per condition per independent experiment were quantified; **p < 0.01 and ***p < 0.001, all relative to the DMSO control, were determined by one-way ANOVA with a Tukey’s multiple comparison test. Bar 5 µm. (f) ECDD-S27 inhibits HT-29 cell survival. Cells were treated with DMSO (negative control), ECDD-S27, or HCQ at the indicated concentrations for 72 h and their viability was measured by the MTS assay. Data are mean ± SD from three independent experiments; the results were expressed relative to the DMSO control, defined as 100%. ***p < 0.001, ECDD-S27 vs HCQ treatment at the same concentration, was determined by one-way ANOVA with a Tukey’s multiple comparison test.

