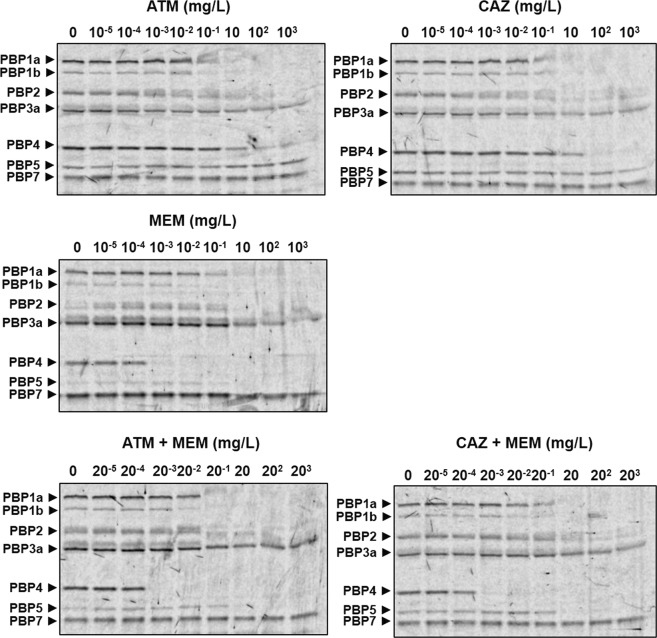
Figure 4.
Titration of P. aeruginosa PA01 PBPs by ATM, CAZ or MEM, or ATM + MEM, or CAZ + MEM. Live cells were treated with 10-fold increasing concentrations of each of the β-lactam treatments listed above prior to labelling of PBPs with a fluorescent analogue of penicillin V (Boc-FL). Cells were sonicated and the protein content in each sample equalised to 8 mg/mL. PBPs were separated via SDS-PAGE on 10% Tris-HCl polyacrylamide gels and visualised using a fluorescent scanner (excitation at 473 nm with a 520 nm emission filter). Gel images shown are representative images from duplicate experiments.

