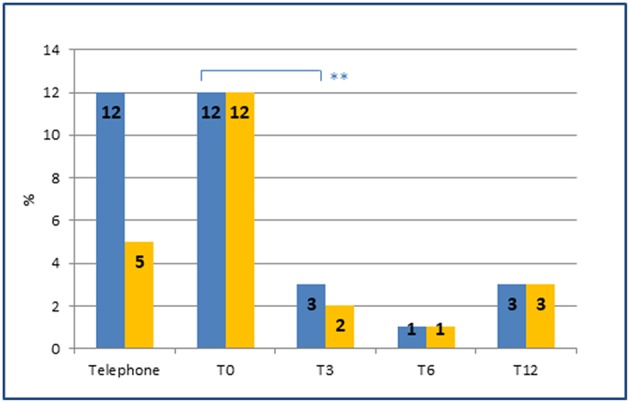
Figure 3.

Prevalence of MOH and of preventive therapies at each time point. Prevalence of MOH (blue) and MOH in preventive therapy (orange) at each time point. Note the sharp reduction of MOH (from 12 to 3%) after the introduction of an appropriate preventive therapy by the headache specialist at T0 (from 5 to 12%). **represents the significance level. p-value < 0.01.
