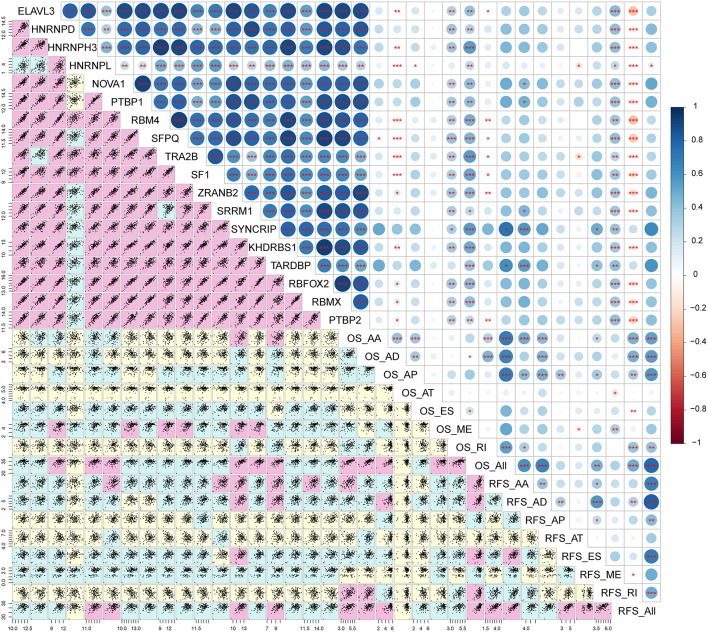
Figure 9.
Correlation analysis between splicing factors and AS prognostic predictors. The lower panel of the figure displays scatter plots of the correlation between expression of splicing factors and the PSI values of survival related AS events. Background color depth represents the weight of the correlation coefficient. Pink, green, and yellow show strong, medium and weak correlations, respectively. The upper panel of the figure demonstrates the correlation coefficient and the significance of the correlation between the expression of splicing factors and the PSI values of survival related AS events. The size and color of the circle represent the weight of the correlation coefficient, *p < 0.05; **p < 0.01; ***p < 0.001.

