Fig. 2.
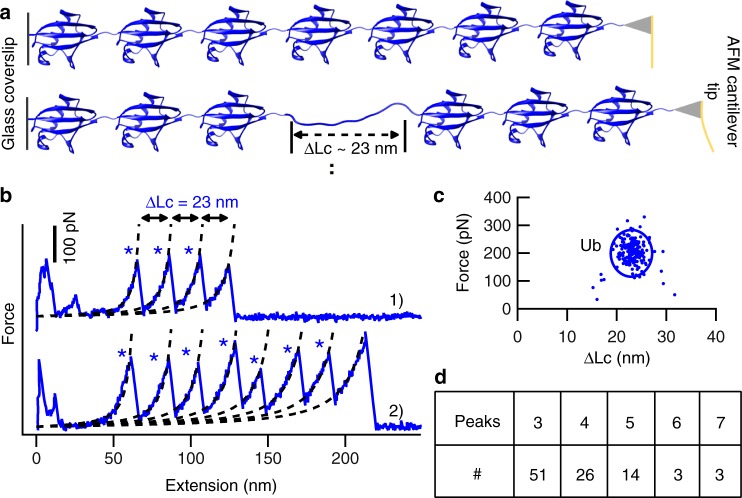
The characterization of OaAEP1-built polyprotein by AFM-based SMFS. a The schematic displays the unfolding of ubiquitin polyprotein by single-molecule AFM, which leads to an unfolding peak with ΔLc of ~23 nm. b Two representative force-extension curves of (Ub)n are shown with expected ΔLc and different peaks indicated by blue star, three peaks in curve 1, and seven peaks in curve 2. c The scatter plot of the (Ub)n unfolding experiment showed the relationship between protein unfolding force (202 ± 44 pN, average ± s.d., n = 198) and ΔLc (23 ± 2 nm, average ± s.d.). d The statistical analysis of the (Ub)n indicated the number of curves with specific unfolding peaks. Most curves showed three (52%) and four (27%) unfolding peaks. Source data of Fig. 2c are provided as a Source Data file

