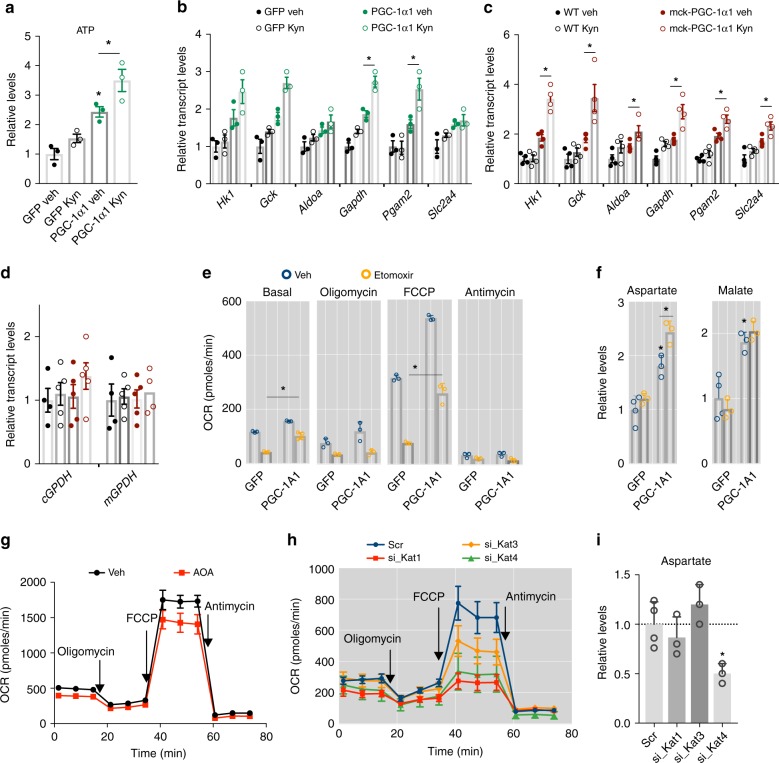
Fig. 3.
The bioenergetic role of Kat/malate-aspartate shuttle integration in skeletal muscle. a Relative levels of ATP in primary myotubes transduced with Gfp control or Pgc-1α1 adenovirus supplemented with 1 μM kynurenine (Kyn) (n = 4). b Relative transcript levels of glycolytic genes in primary myotubes transduced with Gfp control or Pgc-1α1 adenovirus and supplemented with 1 μM Kyn (n = 4). c Relative transcript levels of glycolytic genes in skeletal muscle of wt and mck-PGC-1α1 mice with a single intraperitoneal dose of Kyn (2.5 mg/kg) (n = 4). d Relative transcript levels of glycerol-3-phosphate shuttle genes in skeletal muscle of wt and mck-PGC-1α1 mice treated as in c. e Cellular respiration measured by Extracellular Flux Analysis (SeahorseTM) in primary myotubes transduced with Gfp control or Pgc-1α1 adenovirus and supplemented with 50 μM Etomoxir for 1 h (n = 4). f Relative levels of aspartate and malate in primary myotubes transduced with Gfp control or Pgc-1α1 adenovirus and supplemented with 50 μM Etomoxir for 1 h (n = 4). g Cellular respiration measured as in e of primary myotubes supplemented with 100 μM aminooxyacetate (AOA) for 1 h (n = 4). h Cellular respiration measured as in e of primary myotubes transfected with scrambled siRNA, or siRNAs for Kat1, Kat3 or Got2/Kat4 (n = 4). i Relative levels of aspartate in primary myotubes transfected as in h. Bars depict mean values and error bars indicate SEM. Unpaired, two-tailed student’s t-test was used when two groups were compared, and one-way analysis of variance (ANOVA) followed by Fisher’s least significance difference (LSD) test for post hoc comparisons were used to compare multiple groups, *p < 0.05

