Fig. 7.
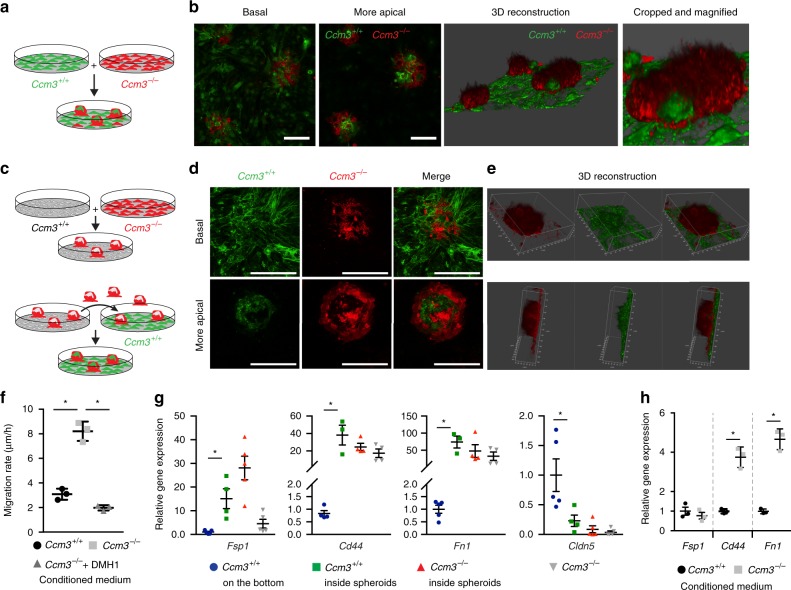
Ccm3−/− cells recruit and induce endothelial-to-mesenchymal transition in Ccm3+/+ cells. a, b Lung immortalised Ccm3−/− endothelial cells expressing LifeAct-mCherry and Ccm3+/+ cells expressing LifeAct-EGFP were co-cultured for 7 days, with spheroids formed, showing experimental scheme (a) and representative confocal images (b). c Non-labelled Ccm3+/+ and LifeAct-mCherry expressing Ccm3−/− cells were co-cultured for 7 days, with the spheroids formed detached by shaking the culture plate. The detached spheroids were collected and added to an already formed monolayer of LifeAct-EGFP Ccm3+/+ cells (see also Supplementary Fig. 7 for more details). d Representative confocal images of the basal and more apical levels of spheroids where Ccm3−/− (red) have recruited Ccm3+/+ cells (green). e Representative three-dimensional reconstructions of spheroids with Ccm3+/+ cells (green) recruited. Scale bars 50 μm (b, d). f Quantification of migratory rates of Ccm3+/+ endothelial cells assessed using the classical wound-healing assay. After the scratch, cells were incubated with medium conditioned by either Ccm3+/+ cells (negative control) or Ccm3−/− cells and without or with the BMP inhibitor DMH1. Data are means ± SE. p < 0.001 among groups (one-way analysis of variance (ANOVA)); *p < 0.01 (Tukey’s post hoc test); n = 3 independent experiments. g Labelled Ccm3+/+ and Ccm3−/− cells co-cultured as described above. After 7 days, spheroids were carefully detached, disaggregated and the cells separated by fluorescence-activated cell sorting (FACS). The cells that remained at the bottom were trypsinised and Ccm3+/+ cells were separated by FACS. In parallel, Ccm3−/− cells were cultured separately as positive control and processed together with spheroids. After FACS, gene expression was analysed by RT-qPCR. Data are means ± SE; p < 0.01 among groups (one-way ANOVA); *p < 0.01 (Tukey’s post hoc test); n = 4 independent experiments. h Ccm3+/+ endothelial cells were incubated for 7 days with medium conditioned by either Ccm3−/− cells or Ccm3+/+ cells (negative control), and the gene expression was analysed by RT-qPCR. Data are means ± SE. *p < 0.01 (Student’s t test); n = 3 independent experiments. Source data are provided as a Source Data file

