Fig. 8.
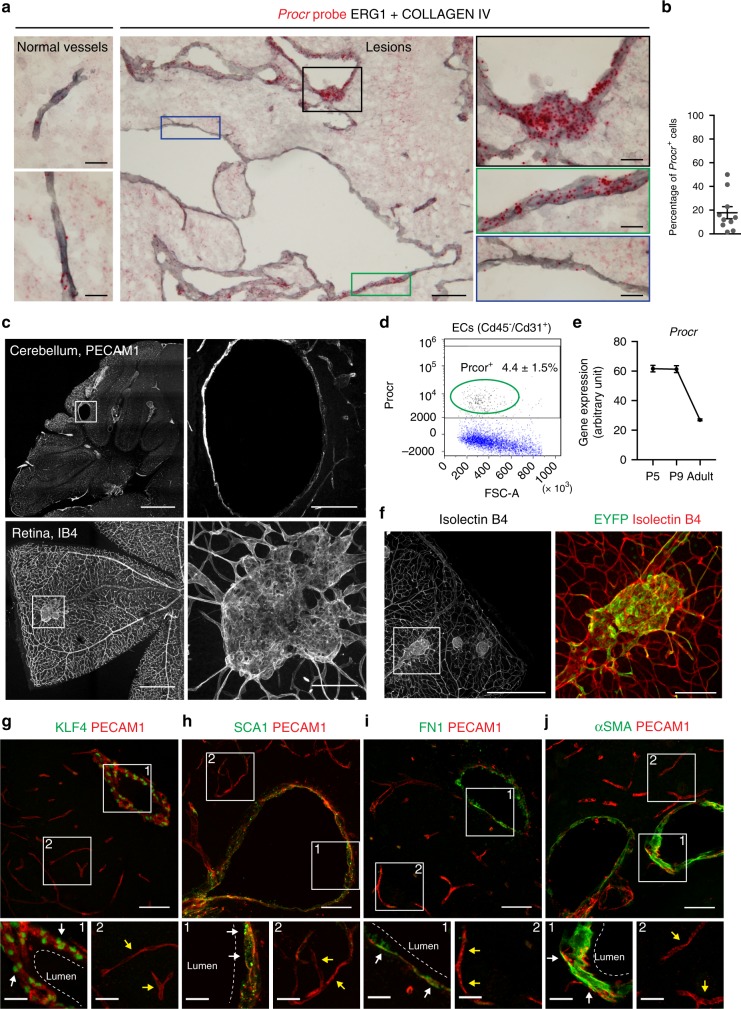
Endothelial progenitors are involved in cavernomas formation. a In situ hybridization for Procr using the RNAScope assay with chronic Ccm3−/− cerebral cavernous malformation (CCM) mouse brains. Red, Procr probe; grey, endothelial cells stained with a combination of anti-COLLAGEN IV and anti-ERG1 antibodies. Black and green panels show endothelial cells with high expression of Procr, blue panel shows cells with no expression of Procr. b Quantification of the percentage of endothelial cells that express Procr within the lesions; n = 10 lesions from 3 animals. c ProcrCreERT2-IRES-tdTomato/+/Ccm3f/f mice received tamoxifen injection at P1 and were analysed at P30. Representative images of the cerebellum stained for PECAM1 and whole-mount retina stained for Isolectin B4. d Fluorescence-activated cell sorting analysis on endothelial cells isolated from wild-type mice at P2. The plot shows the percentage of Procr+ cells among the Cd45−/Cd31+ endothelial cells. Data are means ± SE; n = 3 animals. e RNAseq analysis on endothelial cells isolated from the brain of wild-type mice at different ages, showing the reduction of Procr expression during development. Data are means ± SE from 3 animals each group. Source data are provided as a Source Data file. f ProcrCreERT2-IRES-tdTomato/+/Ccm3f/f/R26-EYFP mice received tamoxifen injection at P1 and were analysed at P30. Representative images of whole-mount retina stained for Isolectin B4 and EYFP showing endothelial cells lining the lesion that underwent recombination. g–j Representative confocal images of brain sections double stained for PECAM1 (red) and the mesenchymal markers (green) KLF4 (g), SCA1 (h), FN1 (i) and αSMA (j). White arrows, cells lining the cavernoma; yellow arrows, cells in normal vessels. Scale bars, 500 μm (c and f main panels); 100 μm (a main panel, c and f magnifications), 50 μm (g–j main panels); 20 μm (a, g–j magnifications)

