Fig. 4.
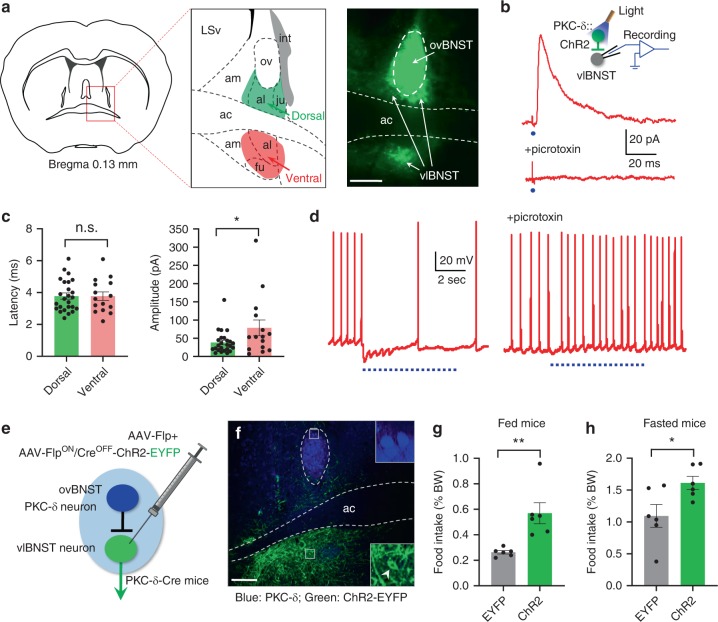
Neurons in vlBNST are inhibited by ovBNST PKC-δ neurons and increase feeding when activated. a Fluorescent nerve terminals from ovBNST PKC-δ neurons are observed in vlBNST (indicated by arrows) at regions both dorsal and ventral to the ac. Note the image on the right was overexposed to reveal the terminal fluorescence. b Whole-cell voltage-clamp recordings on vlBNST neurons show that monosynaptic IPSC can be triggered by light activation of the ovBNST PKC-δ neurons and can be blocked by bath application of picrotoxin. Each blue dot indicates a 2-ms light pulse. c The latency and amplitude of the IPSCs from vlBNST neurons in regions dorsal (green) and ventral (red) to ac. Unpaired t-test, t(38) = 0.02, p = 0.98 (latency), t(38) = 2.2, p = 0.035 (amplitude), n = 25 cells from the dorsal region and n = 15 cells from the ventral region. d Current-clamp recordings on vlBNST neurons show that firing of action potentials can be suppressed by light activation of ovBNST PKC-δ neurons and the suppression can be blocked by picrotoxin. The blue dotted lines indicate the light pulses (15 Hz, 10-ms pulse width). e Diagram shows the Cre-out strategy to express ChR2 in vlBNST neurons. f ChR2-EYFP was expressed in vlBNST neurons (green, arrowhead indicates a ChR2-EYFP positive vlBNST neuron) but not in ovBNST PKC-δ neurons (blue, immunostaining). g, h Food intake was increased in fed (g) and fasted (h) animals when vlBNST neurons were optogenetically activated. Unpaired t-test, t(10) = 3.68 (g), t(10) = 2.53 (h). n = 6 animals in each group. Data are mean ± s.e.m. Scale bars, 200 µm. *p < 0.05, **p < 0.01. Source data are provided as a separate file

