Fig. 5.
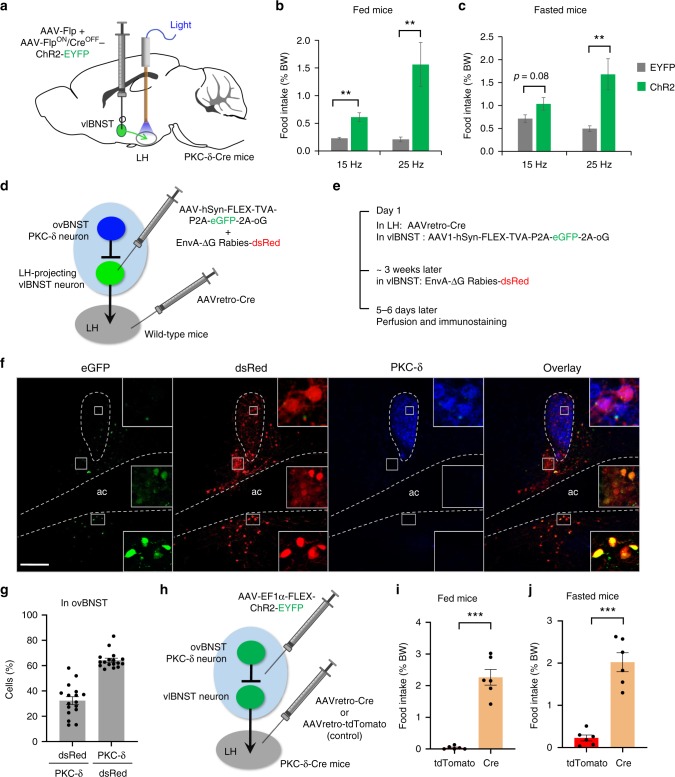
LH-projecting vlBNST neurons antagonize feeding suppression induced by ovBNST PKC-δ neuron activation. a Diagram shows that Cre-out viruses were injected in vlBNST while ferrule fibers were implanted above LH to activate vlBNST-LH pathway. b, c Optogenetic activation of vlBNST-LH pathway increases food intake in both fed (b) and fasted (c) animals in a frequency-dependent manner. Unpaired t-test, t(11) = 4.31 (b, 15 Hz), t(11) = 3.11 (b, 25 Hz), t(11) = 1.92 (c, 15 Hz), t(11) = 3.16 (c, 25 Hz). n = 6 animals for EYFP and 7 for ChR2. d, e Diagram (d) and virus injection procedure (e) to label the upstream neurons that innervate LH-projecting vlBNST neurons. f ovBNST neurons that are monosynaptically upstream to LH-projecting vlBNST neurons (green) are labeled by dsRed (red) and overlapping with PKC-δ immunostaining (blue). Note the LH-projecting vlBNST neuron (starter cells, green) are located in regions both dorsal and ventral to act, but not in ovBNST. g Quantification of the dsRed cells and PKC-δ neurons in ovBNST. n = 17 brain sections from 3 animals. h Diagram illustrating the expression of ChR2 in both the ovBNST PKC-δ neurons and LH-projecting vlBNST neurons. The control group was injected with AAVretro-tdTomato in LH, thus only ovBNST PKC-δ neurons will express ChR2. i, j Co-activation of the ovBNST PKC-δ neurons and LH-projecting vlBNST neurons increased the food intake in fed (i) and fasted (j) animals. Unpaired t-test, t(10) = 8.96 (i), t(10) = 7.64 (j), n = 6 animals in each group. Data are mean ± s.e.m. Scale bars, 200 µm. **p < 0.01, ***p < 0.001. Source data are provided as a separate file

