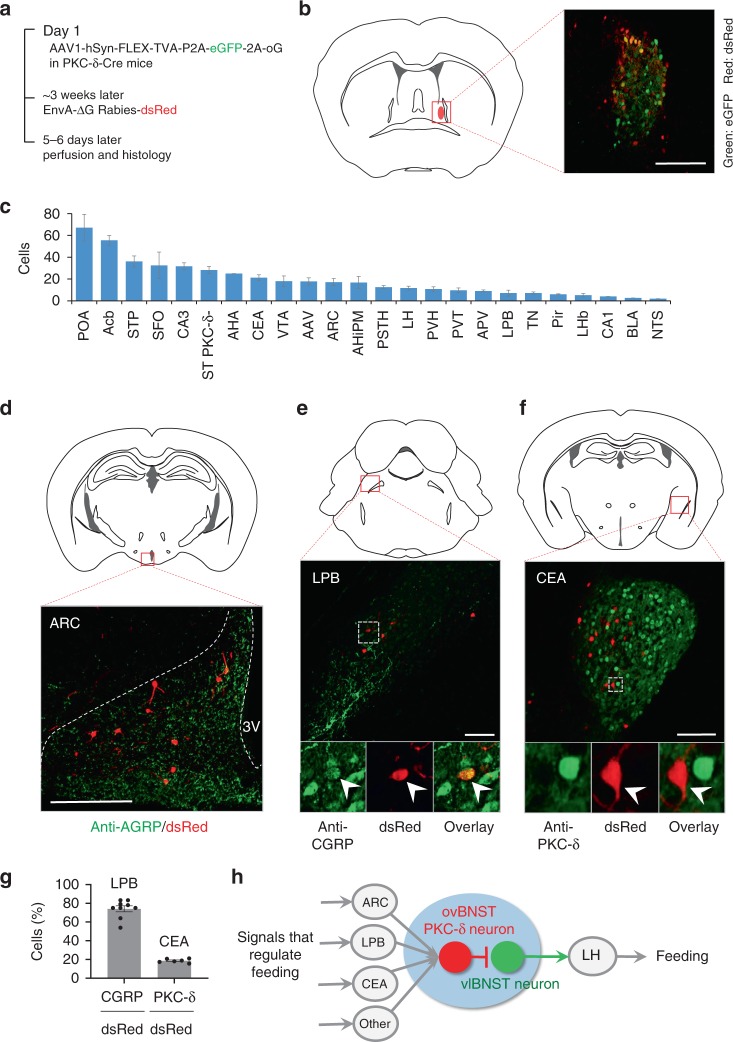
Fig. 6.
ovBNST PKC-δ neurons receive inputs from ARC, LPB, and CEA. a Diagram illustrating the procedure of virus injection for monosynaptic retrograde rabies virus tracing. b ovBNST PKC-δ neurons expressing eGFP and dsRed as starter cells for retrograde tracing. c Major brain regions that send monosynaptic innervation to ovBNST PKC-δ neurons. n = 9 animals. Data are presented as mean ± s.e.m. POA preoptic area, Acb nucleus accumbens, STP BNST posterior, SFO subfornical organ, CA3 hippocampus CA3 region, ST PKC-δ- ovBNST PKC-δ- cells, AHA anterior hypothalamic area, VTA ventral tegmental area, AAV amygdaloid anterior ventral, AHiPM amygdalohippocampal area, posteromedial part, PSTH parasubthalamic hypothalamic nucleus, PVT paraventricular thalamic nucleus, APV amygdaloid posterior ventral, Pir piriform cortex, LHb lateral habenular nucleus, CA1 hippocampal CA1 region, BLA basal lateral amygdala, NTS nucleus solitary tractus. d–f Location and representative images show dsRed cells expressed in ARC (d), LPB (e), and CEA (f) and immunostaining of AGRP, CGRP, and PKC-δ, respectively. g Quantification of the CGRP, PKC-δ staining in dsRed cells. n = 9 animals (ARC), and 6 animals (CEA). h Diagram showing an integrated hierarchy of the brain circuits for feeding regulation. Data are mean ± s.e.m. Scale bars, 200 µm. Source data are provided as a separate file

