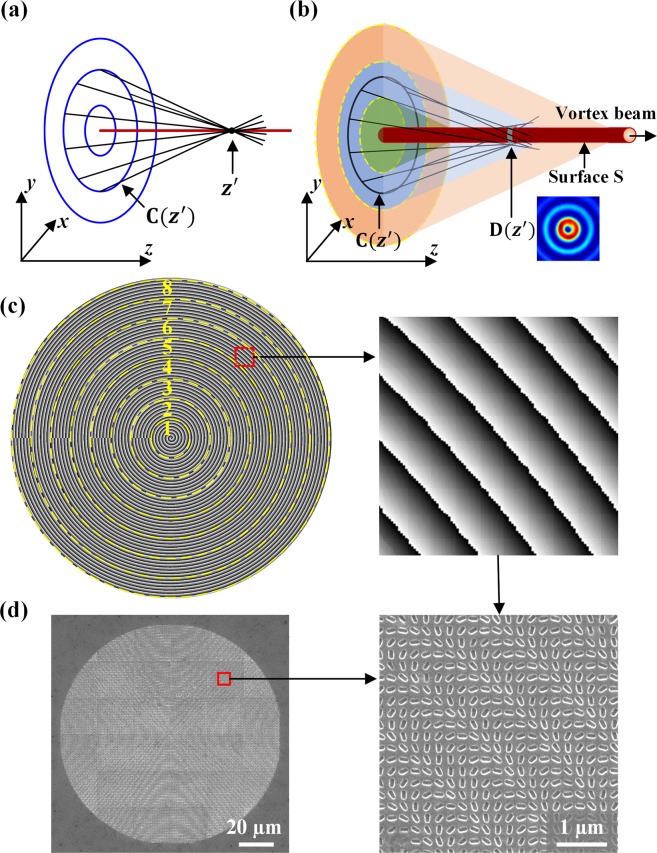
Figure 2.
(a) The formation of caustic curve. (b) The caustic theory with the applied vortex structure into the initial optical field. The input plane is separated by yellow circles to several circular zones of different TCs. (c) The left figure is the phase distribution encoded on the metasurface with eight zones with different TC(n) = 0.5n − 1.5, and n = 1, 2, ∙∙∙, 8. The right figure is the magnified plot of the red rectangular region. (d) The left figure is the complete SEM picture of the entire fabricated metasurface, and the right figure is the magnified SEM picture of the red rectangular region.

