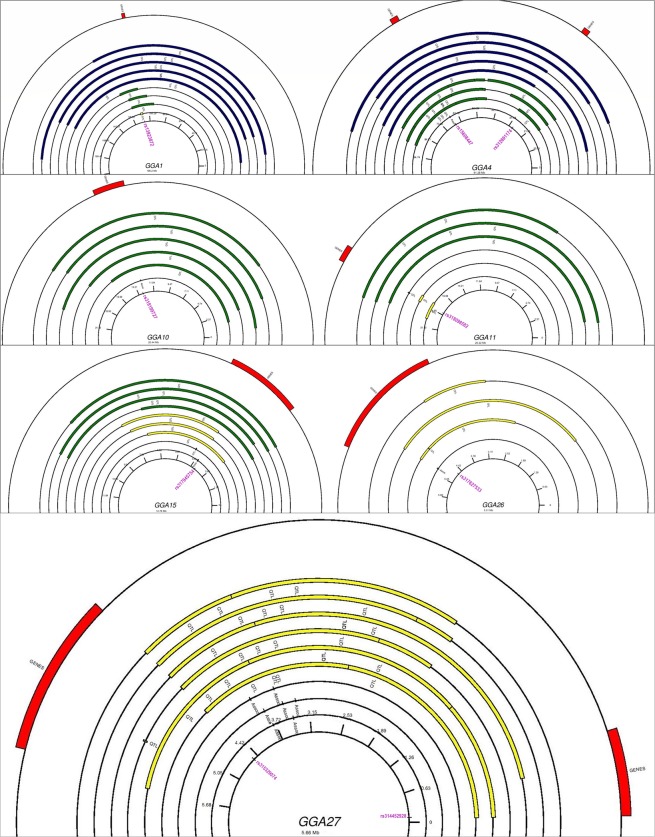
Figure 2.
Circular chromosome maps for seven autosomes presenting combined data of reported QTL (n = 183) and positional candidate genes (n = 462). Blue color represents the extent of large sized QTL (50–196.2 Mb), green color the medium sized QTL (5–50 Mb) and the yellow color is indicative of the small QTL (0–5 Mb). Red color indicates the starting and ending positions of positional candidate genes. The position(s) of the significant SNPs (labeled in purple color) is also given. The figure was constructed using GenomeVx87.

