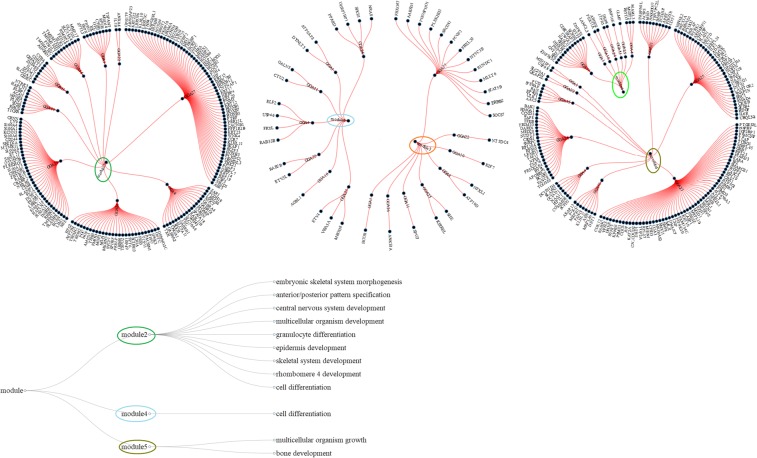
Figure 3.
Network modules along with the significantly enriched developmental processes per module. The five modules are presented in the three radial networks (on the top) as circles/ellipses with different color together with their member genes and the corresponding chromosomes. The diagonal network at the bottom provides the significantly enriched developmental processes per module. Figure was constructed using the data.tree and networkD3 packages in R (http://www.r-project.org/).

