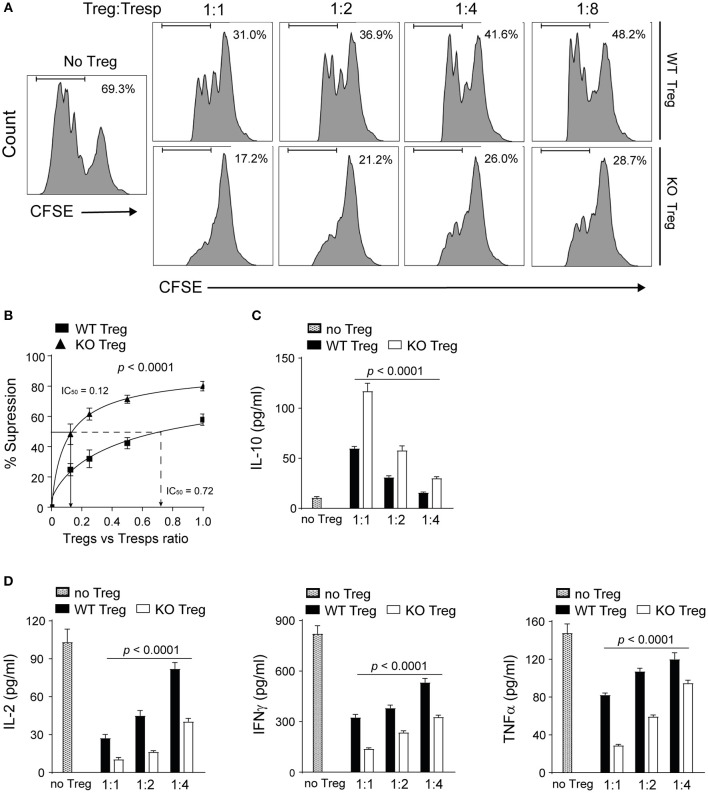
Figure 3.
Absence of PAR4 leads to the enhanced suppressive capacity of Tregs. CD4+CD25+ Tregs from WT spleen and pLN were purified and co-cultured with PAR4ko Tresps and APCs in the presence of anti-CD3 for 72 h. Representative histograms showing the CFSE dilutions of Tresps cultured alone (No Tregs) or with different numbers of WT or PAR4ko Tregs (A). Pooled data showing the percentages of suppression of WT and PAR4ko Tregs [p < 0.0001; (B)]. IC50 values representing the Treg:Tresps ratio required to achieve 50% suppression are shown for the PAR4ko (triangles) and WT (squares) Tregs. Graphs show mean ± SEM from six experiments. Data were analyzed by two-way ANOVA to compare between these two Treg groups. CBA analysis of cytokines IL-10 [p < 0.0001; (C)] and IL-2, IFNγ, and TNFα [p < 0.0001; (D)] in the supernatants obtained from six suppression assays. Graphs show mean ± SEM from four experiments. Data were analyzed by two-way ANOVA to compare between these two Treg groups with a sequential dilution.

