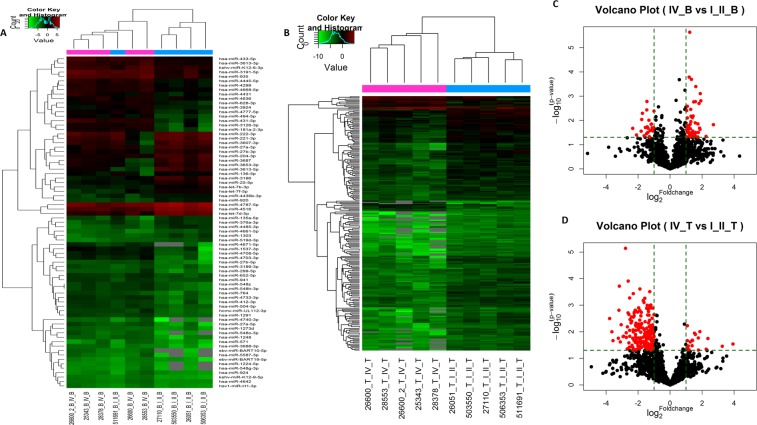
Figure 2.
Differential expression of miRNAs in tissues and arterial blood between SC-GBM and L-SCG. Hierarchical clustering analysis the DEmiRNAs between SC-GBM and L-SCG blood (A) tissues (C) (fold change >2; P < 0.05; N = 5). Volcano plots. The vertical lines correspond to 2.0-fold up- and down-regulation between SC-GBM and L-SCG blood (B) and tissues (D), and the horizontal line represents a P-value. The red point represents the DEmiRNAs with statistical significance.

