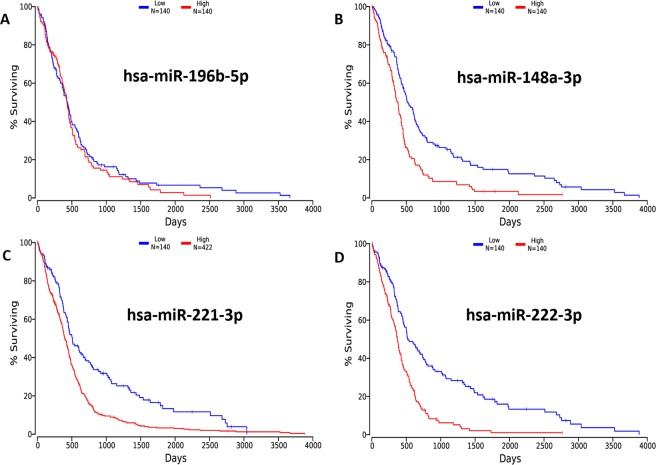
Figure 4.
A Kaplan–Meier curve estimates the association of miRNAs and the survival of patients with GBM. (A) Association between the expression of has-miR-196b-5p and survival days in GBM patient tissue samples. (B) Association between the expression of has-miR-148a-3p and survival days in GBM patient tissue samples. (C) Association between the expression of has-miR-221-3p and survival days in GBM patient blood samples. (D) Association between the expression of has-miR-222-3p and survival days in both GBM patient blood and tissue samples.

