
Figure 5.
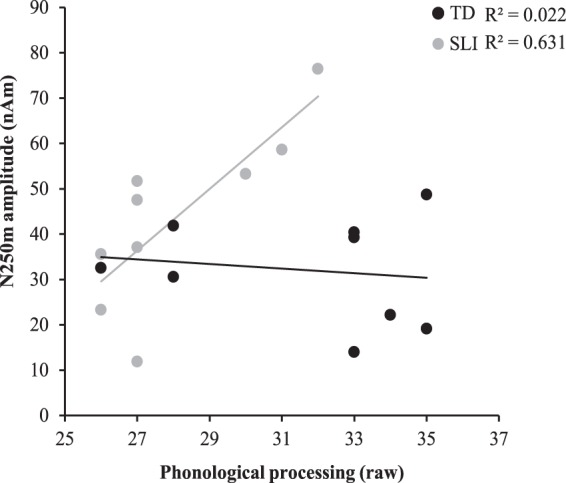
Scatterplot representing the correlation between phonological processing (raw score) and N250m amplitude in the left hemisphere, to contralateral stimulation, for the SLI (grey) and TD (black) group.
Official websites use .gov
A
.gov website belongs to an official
government organization in the United States.
Secure .gov websites use HTTPS
A lock (
) or https:// means you've safely
connected to the .gov website. Share sensitive
information only on official, secure websites.
Scatterplot representing the correlation between phonological processing (raw score) and N250m amplitude in the left hemisphere, to contralateral stimulation, for the SLI (grey) and TD (black) group.