
Figure 3.
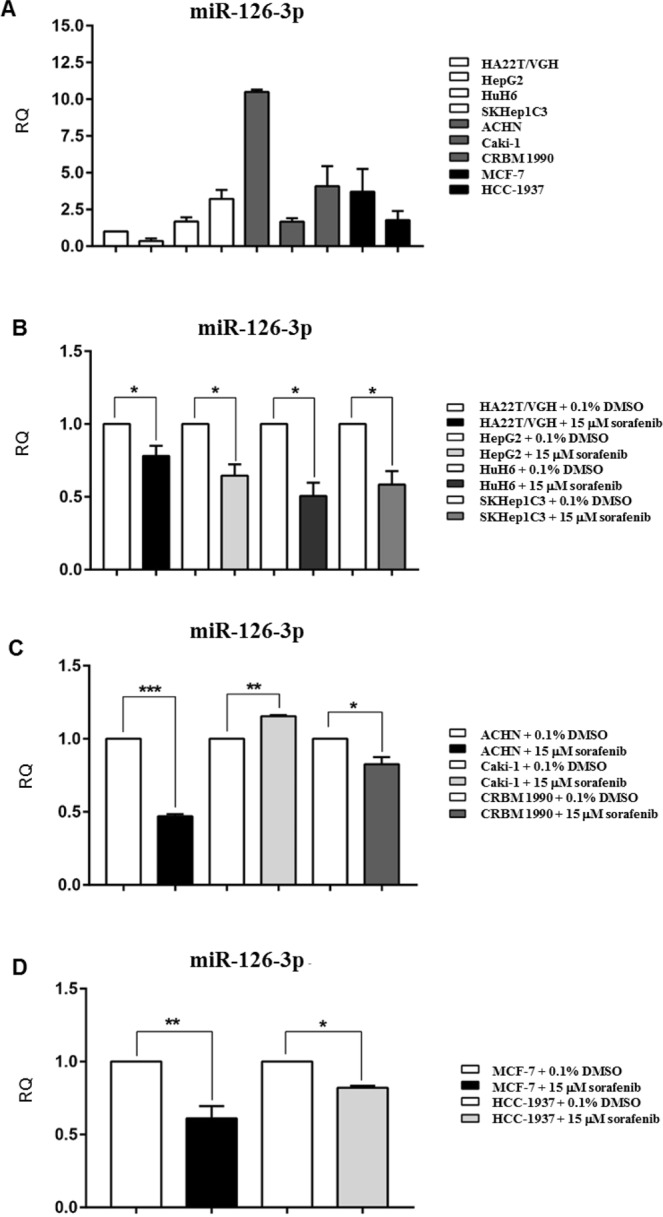
miR-126-3p was differentially expressed in HCC, renal and breast cancer cells and it was mostly down-regulated following the treatment with sorafenib. The expression levels of miR-126-3p in normal growth conditions were determined by qPCR in the cell lines used in this study (A). Expression of miR-126-3p in cancer cells was measured by qPCR when cells were exposed to 0.1% DMSO (open bar) or to 15 μM sorafenib (black or grey bars). miR126-3p expression levels were down-regulated in all hepatocellular (B) and breast (D) cells and in most of renal (C) cells exposed to sorafenib when compared with cells exposed to DMSO. The only exception was Caki-1 where it was up-regulated (C). Unpaired t-test was used to determine the presence of a statistically significant difference between cells exposed to sorafenib and cells exposed to DMSO only: *P-value < 0.05, **P-value < 0.01, ***P-value < 0.001; ****P-value < 0.0001. The bars represent the mean expression values from 3 experiments and the lines represent the standard error of the mean (SEM).