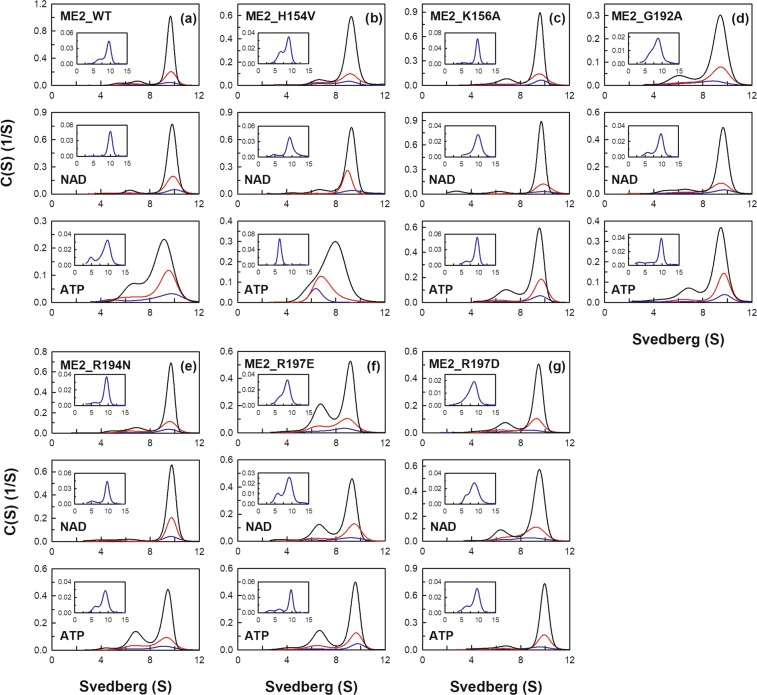
Figure 4.
Continuous sedimentation coefficient distribution of human m-NAD(P)-ME WT and the exosite mutants. The enzyme concentrations were fixed at 1.6, 4.7, and 14.2 μM in PBS. The size distribution plots of apoenzyme (ligand-free), enzyme with NAD+ (0.4 mM), and enzyme with ATP (0.5 mM) were shown on the upper, middle, and lower panels, respectively. (a) ME2_WT; (b) ME2_H154V; (c) ME2_K156A; (d) ME2_G192A; (e) ME2_R194N; (f) ME2_R197E; (g) ME2_R197D.

