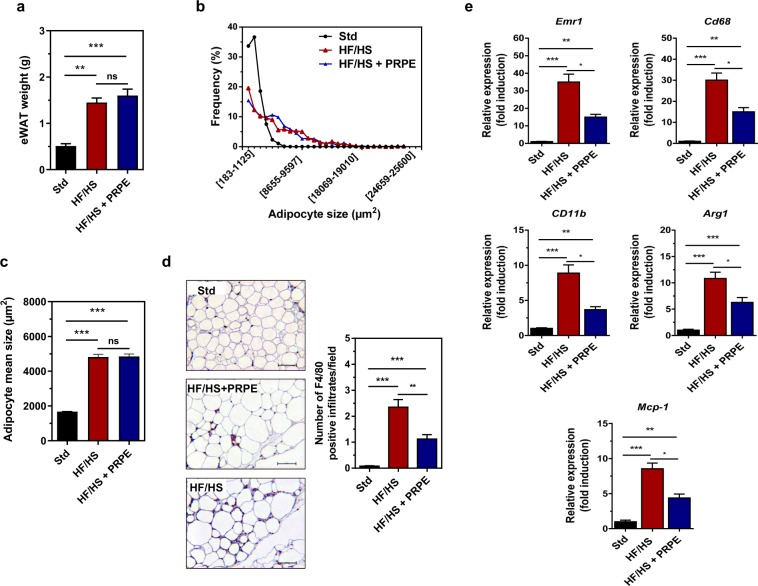
Figure 4.
Supplementation of the diet with PRPE reduces HF/HS-induced eWAT cholesterol accumulation and macrophage infiltration. (a) eWAT weight of mice fed either the Std, HF/HS or HF/HS + PRPE diet. Data are presented as the means ± s.e.m. and were analysed using the Kruskal-Wallis test with Dunn’s post hoc analysis; n = 20 animals in each diet group. **p < 0.01 and ***p < 0.001). (b) Frequency distribution of adipocyte sizes in eWAT from mice in the Std, HF/HS, and HF/HS + PRPE groups. (c) Mean adipocyte sizes (µm2) in mice from groups fed the Std, HF/HS or HF/HS + PRPE diet. Data are presented as the means ± s.e.m. and were analysed using the Kruskal-Wallis test with Dunn’s post hoc analysis; n = 10 mice per diet group. ***p < 0.001. (d) Immunohistochemical (IHC) detection of the macrophage-specific antigen F4/80 in eWAT from Std-, HF/HS- and HF/HS + PRPE-fed mice (20 × magnification, scale bar = 50 µm). Representative images are shown. IHC for F4/80 was quantified by counting F4/80-positive infiltrates in 5 different fields per sample from 2 different sections per sample. Data are presented as the means ± s.e.m. and were analysed using the Kruskal-Wallis test with Dunn’s post hoc analysis; n = 10 animals per diet group. **p < 0.01 and ***p < 0.001. (e) Relative mRNA expression levels of murine macrophage markers in mouse groups after 180 days of the diet intervention. 36B4 was used as a housekeeping gene to calculate the ΔCt. Data are presented as the mean fold changes ± s.e.m. calculated with the 2−ΔΔCt method. Data were analysed using the Kruskal-Wallis test with Dunn’s post hoc analysis; n = 20 animals per diet group. *p < 0.05, **p < 0.01, and ***p < 0.001.

