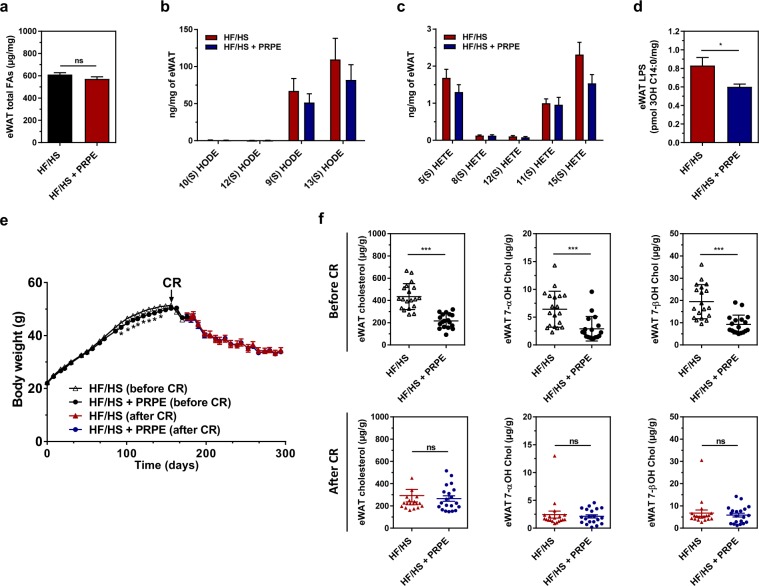
Figure 6.
Mobilization of lipids in adipose tissues by caloric restriction. The levels of total fatty acids (a), HODEs (b) and HETEs (c) were measured in the eWAT from mice fed mice fed either the HF/HS or HF/HS + PRPE diet for 180 days by using LC-MS/MS. Data are presented as the means ± s.e.m. and were analysed using the Mann-Whitney U-test, n = 20 (HF/HS) and n = 20 (HF/HS + PRPE) for a) and multiple Student’s unpaired t-tests; n = 20 (Std) and n = 20 (HF/HS) for (b,c). (d) Lipopolysaccharide (LPS) levels in the eWAT of mice fed either the HF/HS or HF/HS + PRPE diet for 180 days. Data are presented as the means ± s.e.m. and were analysed using the Mann-Whitney U-test; n = 20 (HF/HS) and n = 20 (HF/HS + PRPE). *p < 0.05. (e) Caloric restriction (CR) protocol: mice were fed ad libitum for 180 days with either the HF/HS or HF/HS + PRPE diet, and then a 30% reduction in energy intake was performed for an additional 120 days. Changes in the body weight of mice in each group are shown. Data are presented as the means ± s.e.m. and were analysed by using one-way ANOVA, n = 20 (HF/HS) and n = 20 (HF/HS + PRPE). ***p < 0.001. (f) eWAT cholesterol and cholesterol oxide content was assessed by GC/MS in fasted mice fed the HF/HS or HF/HS + PRPE diet for 180 days (upper panel, before CR) and after 120 days of caloric restriction (lower panel, after CR). Data are presented as the means ± s.e.m. and were analysed by using the Mann-Whitney U-test; n = 20 (HF/HS) and n = 20 (HF/HS + PRPE) before and after CR. ***p < 0.001.

