Fig. 4.
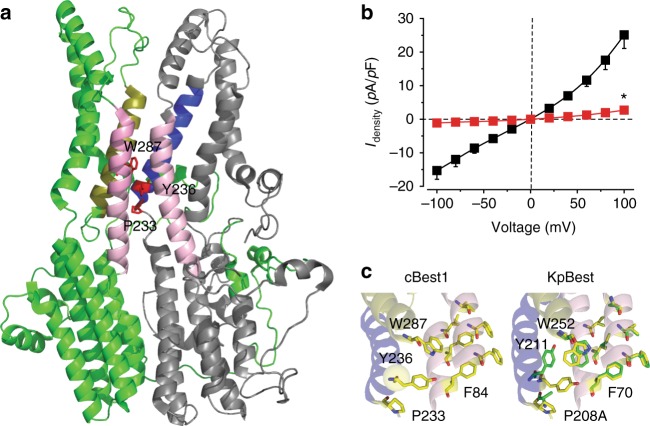
Structural and functional analyses of human bestrophin1 (hBest1) P233A/KpBest P208A. a Ribbon diagram of two adjacent (72°) protomers of a cBest1 pentamer with the extracellular side on the top. The side chains of P233, Y236, and W287 are shown in red. Helices surrounding the critical residues (F84, P233, Y236, and W287) are labeled in the same colors as those in c for comparison. b Population steady-state current density–voltage relationships in HEK293 cells expressing hBest1 WT (black) and P233A (red), with Cl− in the external solution in the presence of 1.2 μM Ca2+, n = 5–6 for each point. *P < 0.05 compared to cells expressing WT hBest1, using two-tailed unpaired Student’s t test. c Visualization of the structural alteration. cBest1, Ca2+ labeled as yellow sphere; KpBest, showing critical residues on WT (yellow) and P208A (green). All error bars in this figure represent s.e.m.

