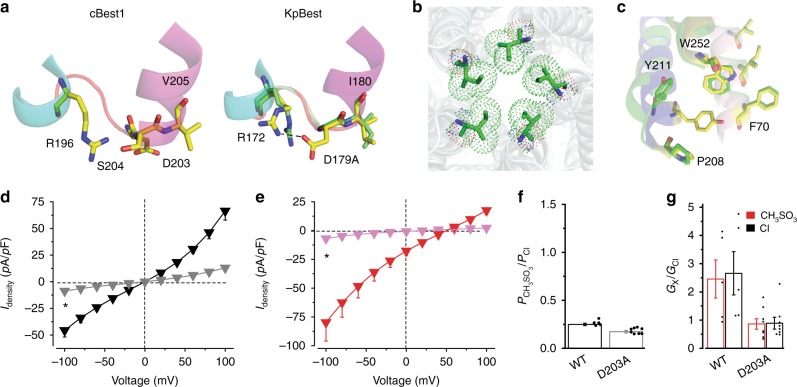
Fig. 6.
Structural and functional analyses of human bestrophin1 (hBest1) D203A/KpBest D179A. a Visualization of the structural alteration, showing critical residues on wild-type (WT; yellow) and the mutant (green). The loop is labeled in red for WT and in green for the KpBest D179A mutant. b Aperture of KpBest D179A as viewed from the same direction as in Fig. 3a, b. Critical residues on the apertures are colored by element. c Visualization of the neck region of KpBest D179A, showing critical residues on WT (yellow) and the mutant (green). Helices surrounding the critical residues (F70, P208, Y211, and W252) are labeled in the same colors as those in Fig. 4 for comparison. d Population steady-state current density–voltage relationships in HEK293 cells expressing hBest1 D203A, with Cl− in the external solution in the absence (gray) or presence (black) of 1.2 μM Ca2+, n = 12–14. *P < 0.05 compared to cells in the presence of Ca2+, using two-tailed unpaired Student’s t test. e Population steady-state current density–voltage relationships in HEK293 cells expressing hBest1 D203A, with CH3SO3− in the external solution in the absence (magenta) or presence (red) of 1.2 μM Ca2+, n = 8–9 for each point. *P < 0.05 compared to cells in the presence of Ca2+, using two-tailed unpaired Student’s t test. f Relative ion permeability ratios (PCH3SO3/PCl) calculated from the Goldman–Hodgkin–Katz equation, n = 5–8 for each bar. g Relative ion conductance ratios (GX/GCl) measured as slope conductance at the reversal potential plus 50 mV (CH3SO3−/Cl−, red) or minus 50 mV (Cl−/Cl−, black), n = 5–8 for each bar. All error bars in this figure represent s.e.m.

