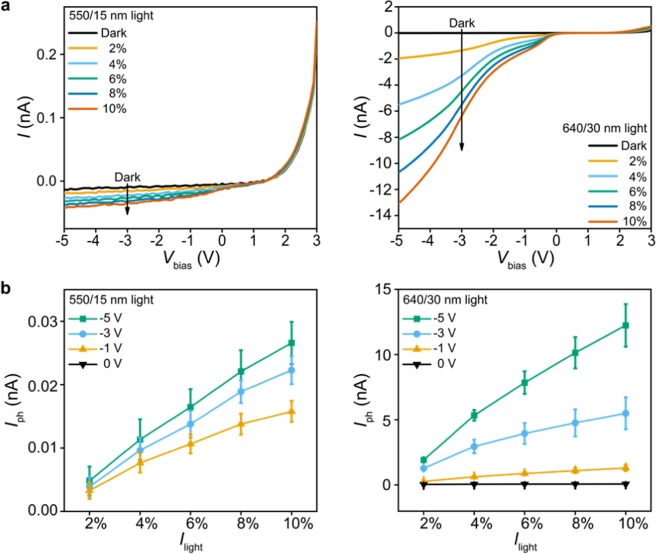
Figure 2.
Wavelength selectivity and pixel-to-pixel variation. (a) Measured I − Vbias curves of a PD pixel at 550/15 nm (left) with Ilight ranging from 5.2 mW (2%) to 26 mW (10%) and at 640/30 nm (right) with Ilight ranging from 4.62 mW (2%) to 23.1 mW (10%), respectively. (b) Iph vs. Ilight with the pixel biased at Vbias = 0 V, −1 V, −3 V and −5 V and illuminated at 550/15 nm (left) and 640/30 nm (right) wavelengths. Statistics are based on measurements from eight pixels, four in the center and the other four at the corner of the 8-by-8 array. The error bars represent ±1 s.d.

