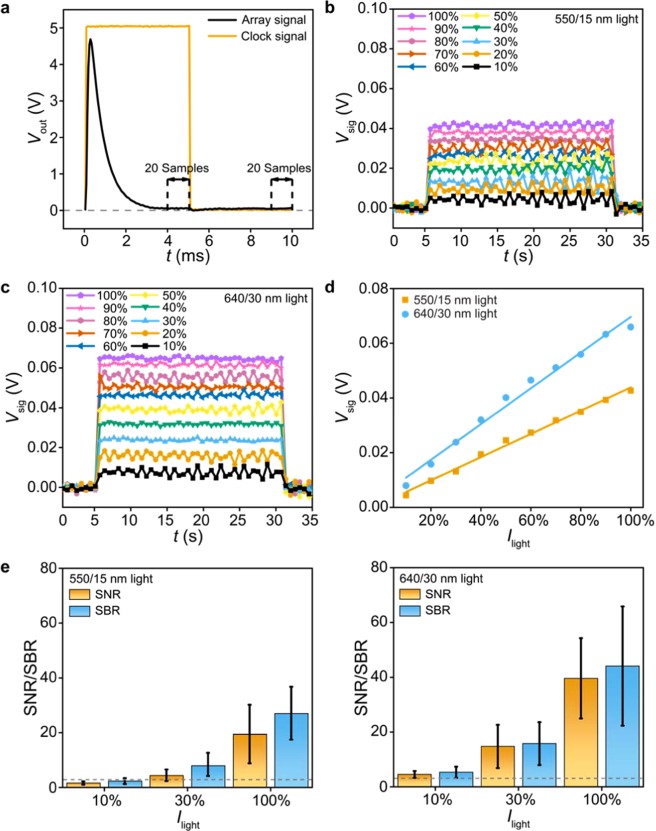
Figure 3.
Linearity and limit of detection. (a) Measured 10 ms Vout-trace of one pixel in the dark (50 μs per sample) and the clock signal employed for array scanning. The pixel signal (Vsig) during each frame of the array is averaged from two 1-ms steady-state data in the Vout-trace (i.e. a total of 40 samples marked by dashed lines). (b) Measured 40 frames of Vsig values when the array is illuminated at 550/15 nm with Ilight ranging from 26 mW (10%) to 260 mW (100%). (c) Measured 40 frames of Vsig values when the array is illuminated at 640/30 nm with Ilight ranging from 45.1 μW (10%) to 451 μW (100%). (d) Vsig (40-frame average) vs. Ilight under 550/15 nm and 640/30 nm illuminations. (e) Measured SNR and SBR values under 550/15 nm (left, 260 mW at 100%) and 640/30 nm (right, 451 μW at 100%) illuminations. Dashed lines indicate SNR = 3 and SBR = 3. Statistics are based on measurements from eight pixels, four in the center and the other four at the corner of the 8-by-8 array. The error bars represent ±1 s.d.

