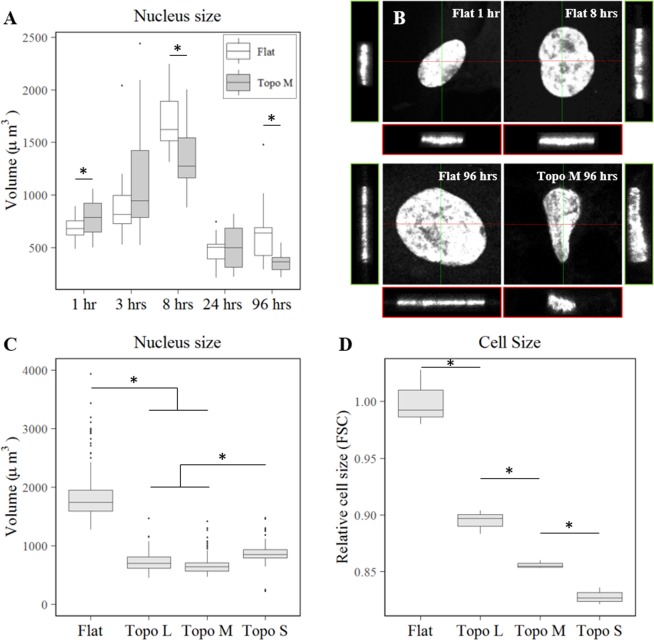
Figure 3.
Topographical induced decrease in both nucleus and total cell size. (A) Dynamic change of nucleus volume (N > 11) in hMSCs cultured on flat and topography M after 1, 3, 8, 24, and 96 hours as quantified using confocal micrographs. (B) Volume views of representative nuclei after 1 and 8 hours on flat, and after 96 hours on flat and topography M. (C) Confocal micrograph quantification of nucleus volumes of cells on topographies with varying topographical feature size (S, M, and L) after 72 hours (N = 4). (D) Flow cytometer measurements of relative cell size after 72 hours on topographies with varying topographical feature size (S, M, and L) (N = 4). Statistical significance stars represent differences between conditions at a given time point with p < 0.05.

