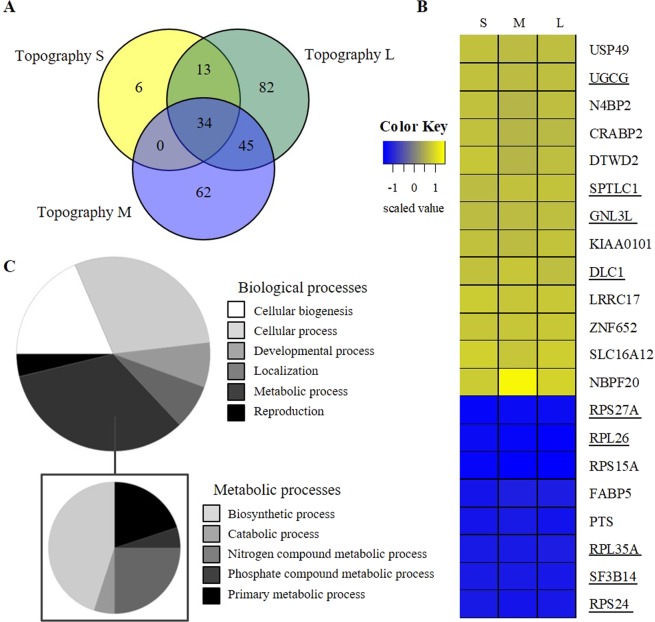
Figure 4.
Topography induced differences in gene expression profiles. Microarray analyses of hMSCs after 7 days on topographically enhanced (S, M, and L) substrates compared to flat (N = 3). A) Venn diagram represents the number of DEGs which were unique for the topography conditions or which overlapped with the other condition(s). (B) Z-score scaled heatmap with DEGs, for each topography (S, M, and L), which were found in all three topographies. Underlined genes are involved in metabolic processes. (C) Proportional distribution representing the panther gene ontology classification analysis grouping the 34 DEGS to biological processes based on their gene ontology annotation. The list of DEGS linked to metabolic processes was specified further in a similar manner.

