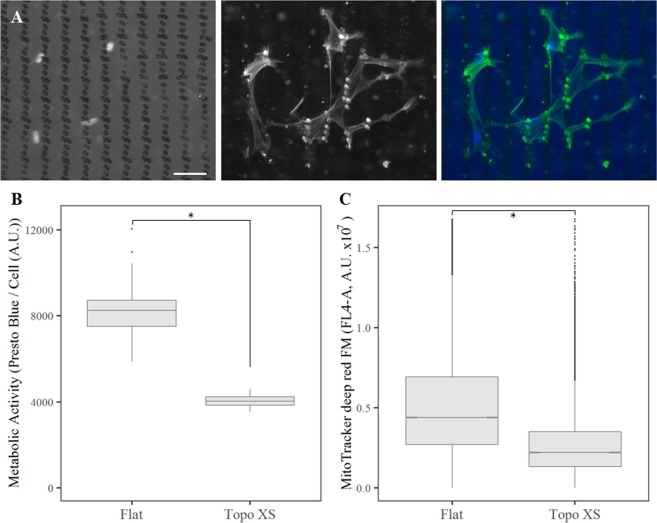
Figure 6.
Mild cellular confinement leads to decreased metabolic activity. (A) hMSCs exposed for 72 hours to topography XS show mild confinement in morphology. Left shows DNA stained with DAPI, middle shows the actin cytoskeleton stained with phalloidin, right is a merge of both channels. Notes: left, one can appreciate the surface topographical features as darker spots. Middle, light captured from outside of the cellular boundaries comes from auto-fluorescence of the polystyrene. Scale bar represents 50 µm. (B) Presto Blue analysis for mitochondrial activity in hMSCs after 72 hours of culture on flat and topographically enhanced (XS) substrates (N = 5). (C) Flow cytometer quantification of the mitochondrial abundance in hMSCs cultured after 72 hours on topography XS compared to flat polystyrene (N = 3). In both B and C the differences between flat and topography XS are significant with p < 0.05, as indicated by the statistical significance star.

