FIGURE 2.

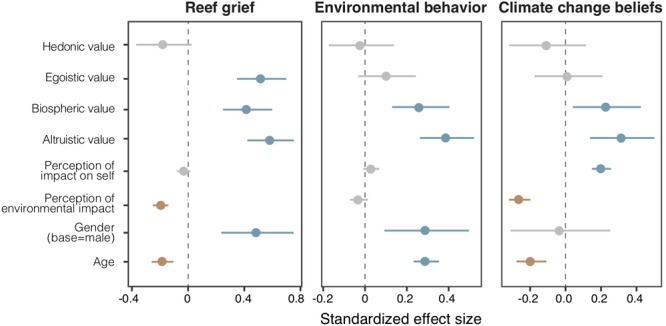
Regression plots showing the significance of cultural values, perceptions of impact (on self and environment), and demographic variables on each climate change response (reef grief, behavior, and beliefs).

Regression plots showing the significance of cultural values, perceptions of impact (on self and environment), and demographic variables on each climate change response (reef grief, behavior, and beliefs).