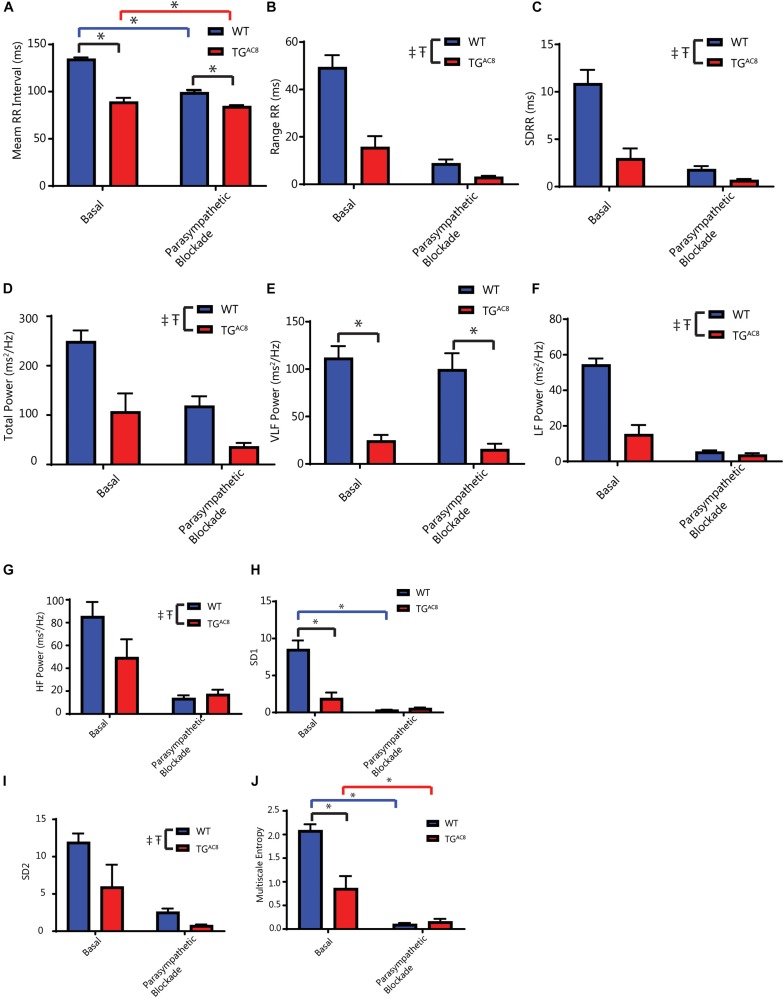
FIGURE 4.
Effects of parasympathetic blockade (atropine) on mean in vivo RR intervals and selected HRV parameters. (A) Average RR interval, interaction F-value of 10.883, p-value of 0.009. (B) Range of RR intervals. (C) Standard deviation of RR intervals. (D) Total power. (E) Very low frequency power. (F) Low frequency power. (G) High frequency power. (H) Poincare plot SD1, interaction F-value of 7.367, p-value of 0.023. (I) Poincare plot SD2. (J) Multiscale entropy (E1), interaction F-value of 26.180, p-value of 0.0006. ‡p < 0.05 for main effects of genotype differences. Tp < 0.05 for main effects of drug differences. *p < 0.05 for significant pairwise differences, if a significant interaction effect was found, as determined by a linear mixed effects model. F-value and p-value provided for significant interactions. N = 6 for WT basal and N = 5 for TGAC8.

