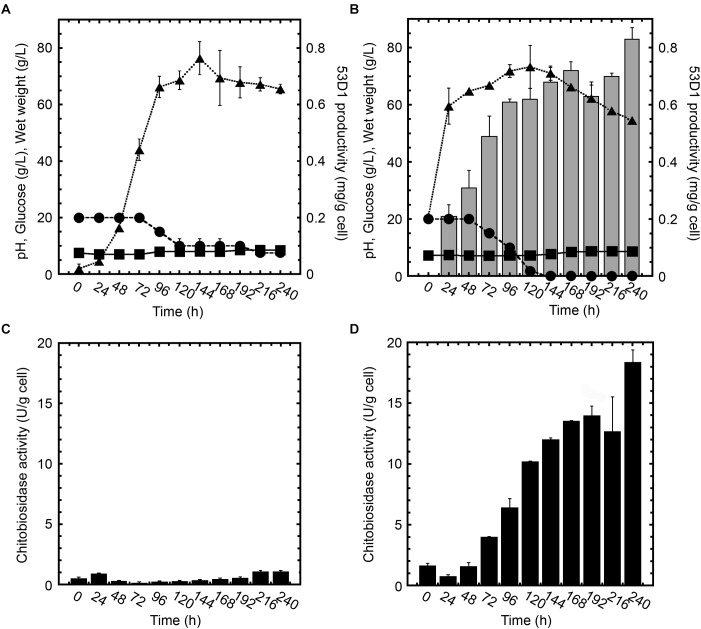
FIGURE 2.
Growth curves, 53D1 production (A,B), and chitinase activities (C,D) in S. coelicolor/pIJ86 (left panels) and S. coelicolor/pIJ86::53D1 (right panels), grown in YEME medium. In panels (A,B), wet weight ( , dotted line), pH (
 , solid line), glucose consumption (•, dashed line), and 53D1 production determined by western blot analysis of cell-free culture broths (gray bars). In panels (C,D), chitinase activity of cell-free culture broths measured by fluorimetric activity assay on 4-MU-(GlcNAc)2 as substrate (black bars).

