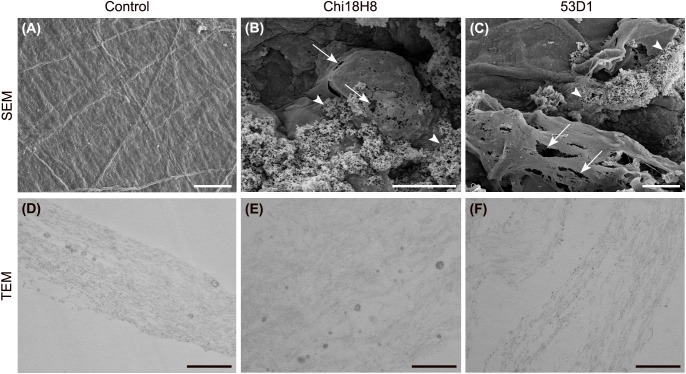
FIGURE 4.
Morphology of the peritrophic matrix treated with chitinases. SEM (A–C) and TEM (D–F). (A,D) Control samples; (B,E) in PM treated with Chi18H8, ruptures of the superficial layers (arrows) and alteration of the fibril network (arrowheads) are visible, as confirmed by TEM analysis; (C,F) similar effects can be observed in PM treated with 53D1. Bars: (A–C) 10 μm; (D–F) 0.5 μm.

