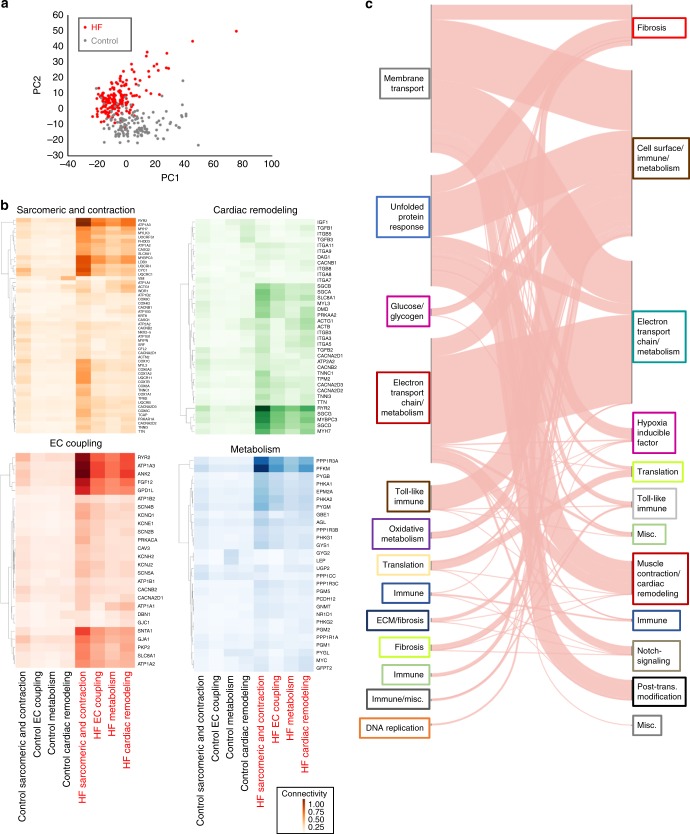
Fig. 1.
Regulatory rewiring of coexpression networks in HF. a Principal component analysis of gene expression profiles for 177 failing hearts and 136 nonfailing, control, hearts showing clear segregation of HF (red) vs. control (gray) population. b Differential connectivity of known biological processes in HF. Normalized connectivity (sum of WGCNA weights divided by maximum network weight) between representative genes from four known processes that play critical roles in HF (sarcomeric and contraction genes (orange), EC coupling (red), cardiac remodeling (green), and metabolism (blue)) to all genes from those same processes in HF and controls. Genes of each process are rows and columns are process and cohort. For example, MYBPC3 in the cardiac remodeling process (third row in green heat map) is highly connected to sarcomeric and contraction genes and cardiac remodeling genes in the HF network (fifth and eighth columns respectively) compared to all the control processes. c River plot demonstrating changing modular assignments for genes in the HF vs. control networks. Pink lines represent individual genes, with left-sided grouping representing membership in control (left) and HF (right) network modules (indicated by color of text box) and right-sided grouping in HF network modules, with text indicating module names derived from KEGG and Reactome associations of genes within each module

