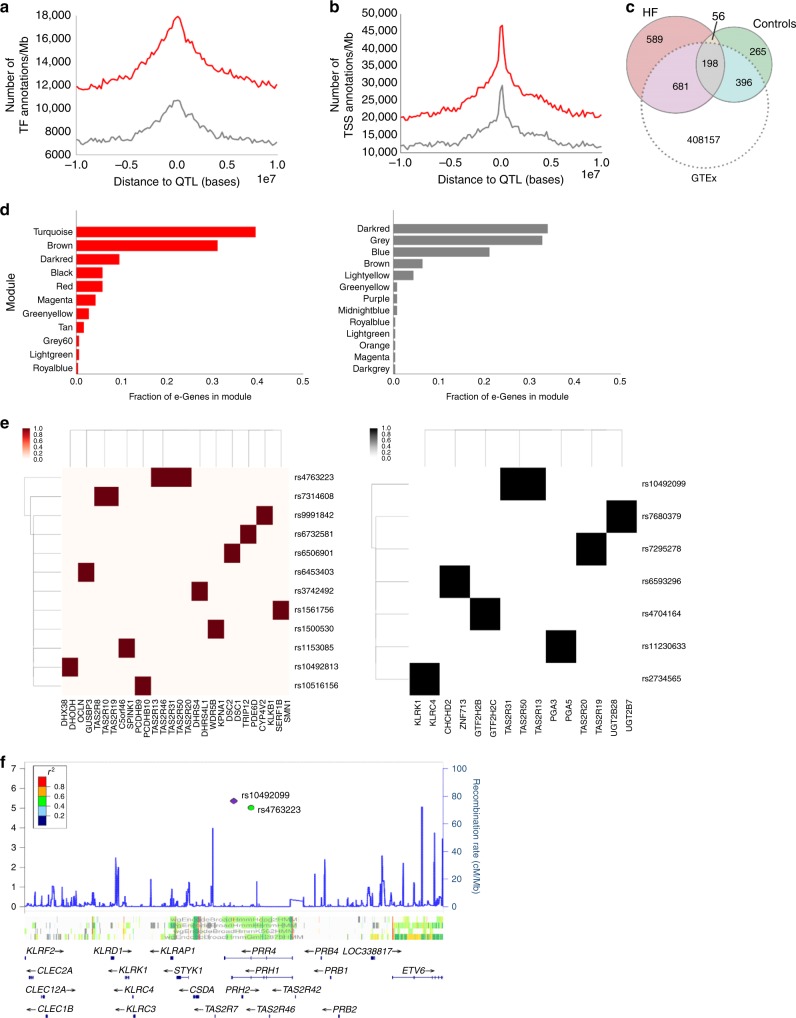
Fig. 2.
High-quality tissue expression reveals previously undetected cardiac eQTL associations. Transcription factor (a) and transcription start site (b) annotation to eQTL distance distributions for failing (red) and control hearts. c Number of cis eQTLs found for each group that overlapped with GTEx eQTLs. d Fraction of modules with genes found to be controlled by at least one eQTL in HF (red, left) and controls (gray, right). e Heat map indicators for variants controlling multiple genes in-cis in HF (red, left) and controls (gray, right). In the rows are SNPs controlling genes (columns) colored intensely if the SNP controls the gene. f Variants from one locus control a network of G-protein-coupled receptors TAS2R present in both the failing and control groups

