Figure 1.
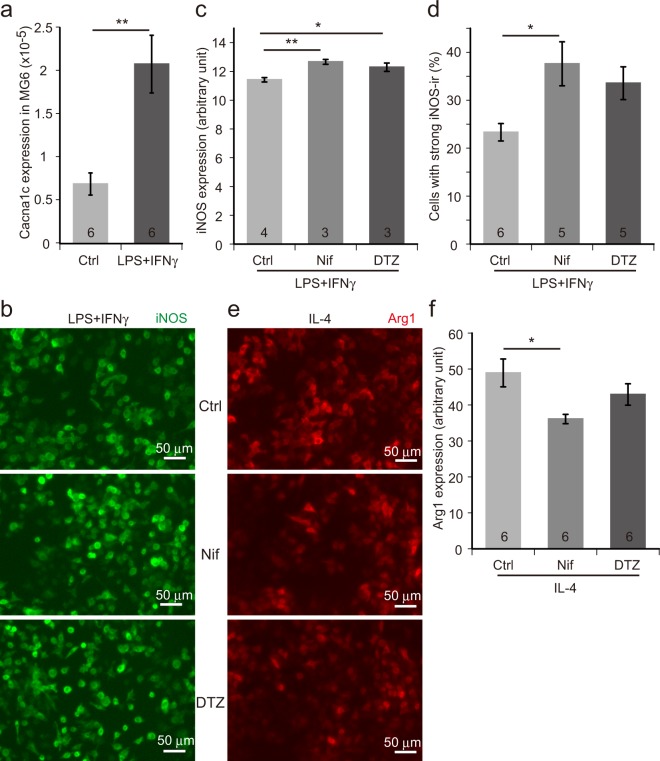
Pharmacological blockade of L-type Ca2+ (Cav1.2) channel enhances M1 marker expression and suppresses M2 marker expression in MG6 cells. (a) Expression of Cacna1c in MG6 cells stimulated with LPS (25 ng/ml) + IFNγ (5 ng/ml) as assessed by quantitative RT-PCR. The numbers in the columns represent the number of samples, which were derived from three independent cultures. (b) iNOS immunocytochemistry images of MG6 cells treated with LPS (2.78 ng/ml) + IFNγ (0.56 ng/ml) in the presence of L-type channel blockers (nifedipine or diltiazem). (c) Quantification of iNOS immunoreactivity (iNOS-ir) in (b). Averaged intensities of the ir signals per cell are compared. (d) Percentage of cells with strong iNOS-ir compared to all the iNOS-positive cells. (e) Arg1 immunocytochemistry pictures of MG6 cells incubated with IL-4 (100 ng/ml) in the presence or absence of L-type channel blockers (nifedipine or diltiazem). (f) Measurement of Arg1-ir in (e). Mean ir signal intensities are measured. Ctrl, control. Nif, nifedipine. DTZ, diltiazem. Scale bars, 50 µm. Data are presented as mean ± SEM. **p < 0.01 by Welch’s t-test in (a), *p < 0.05, **p < 0.01 by a multiple comparison (Tukey-Kramer test) in (c,d,f). The numbers shown in the columns in (c,d,f) represent the number of samples, which were obtained from at least three independent cultures.

