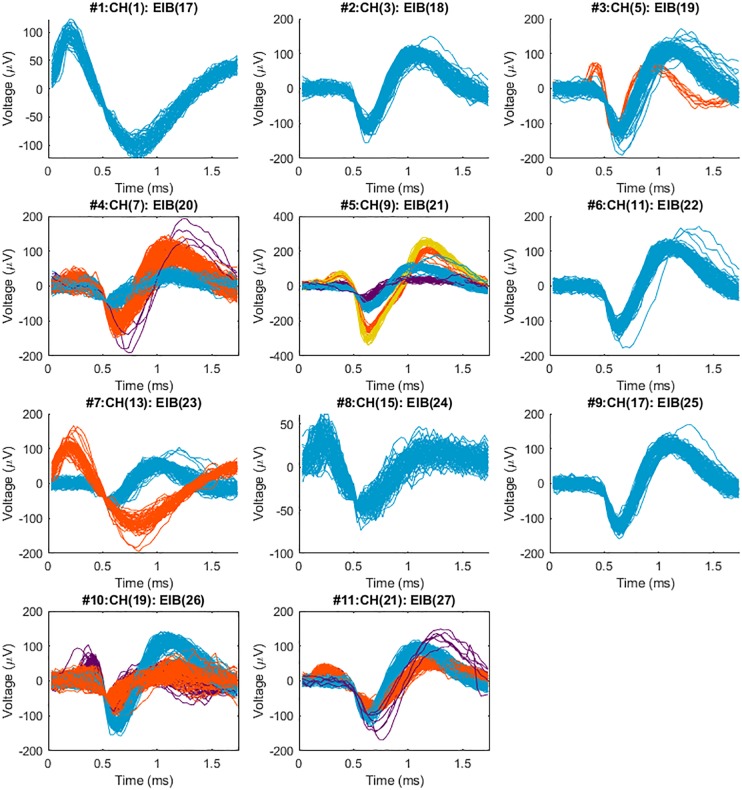
FIGURE 8.
Sorted neural spikes recorded from the spinal cord of a spinal bull frog collected with a 2nd generation MBM constructed BMEP. The BMEP used for this recording consisted of 6 × 2 × 9.6 μm wires (11 recording channels and 1 reference channel) constructed in the new braid system. The recording time was 60 s per trial. Five trials which were recorded at the location and depth (right lateral 300 μm from the center, caudal 800 μm from the L2 root, the 400 μm depth) were concatenated in time series with 60 s time difference between trials and sorted with T-Dist E-M scan method in POS v3.3.5. Above spike waveforms were imported and visualized in Matlab after being sorted in the POS. The maximum SNR (signal to noise ratio) was 38.9 in #5 (the average of yellow spikes), the minimum SNR was 5.2 in #8, average SNR across 11 channels was 14.5 and standard deviation of SNR across 11 channels was 8.0. A maximum of 4 different shapes of neural spikes was observed per channel (in #5) and 2–3 different shapes of neural spikes were easily observed per channel.

