FIGURE 9.
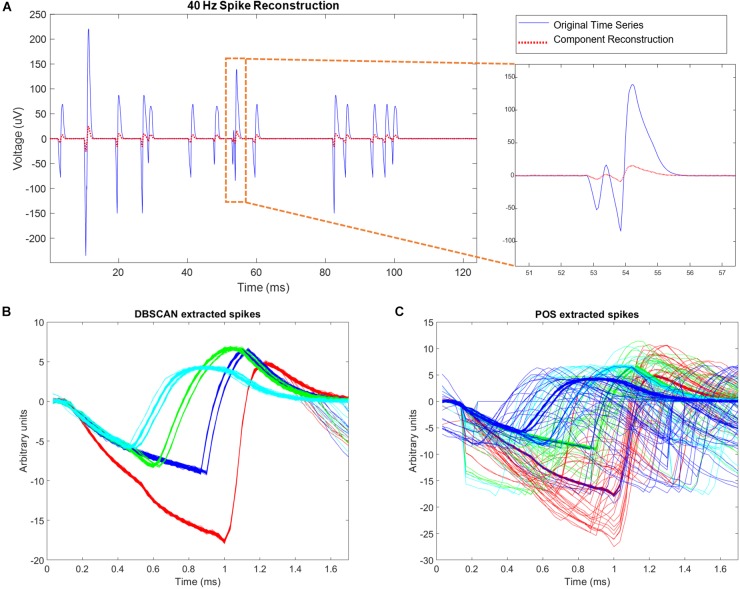
Simulation results. (A) Left hand side of the figure shows simulated site activity without noise added in blue, and independent components derived from noisy wire outputs in red. The four different spike shapes can be detected in this figure. On the right hand side of the figure, a site level collision is observed, and preserved by ICA. The activation scale and signal scale differ but the correlation coefficient of the reconstruction is 0.99. (B) DBSCAN method showing recovery of only clean non-colliding spikes. (C) Plexon Offline Sorter (POS) extracted spikes showing variation in spikes shapes caused by presence of spike collisions that are being assigned to spike clusters.

