Figure 5.
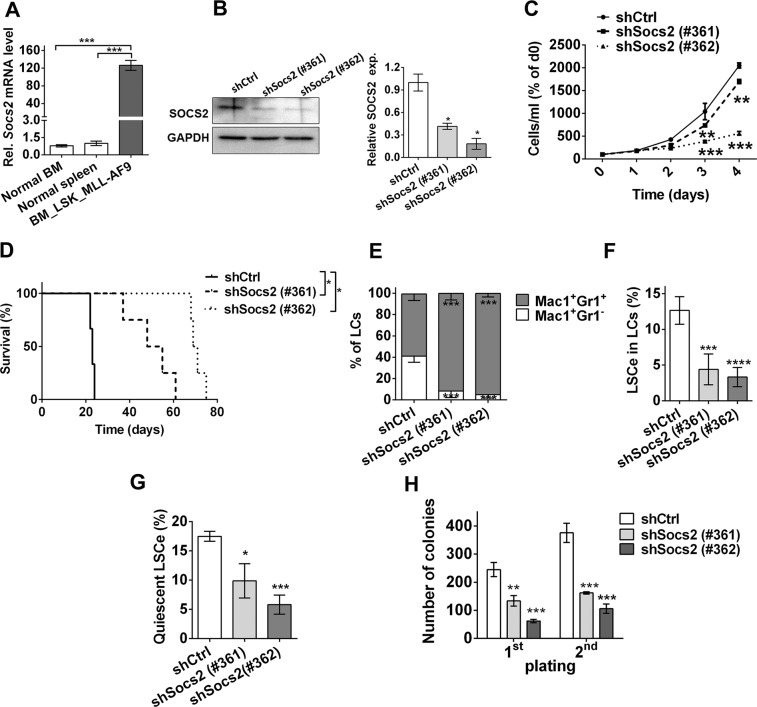
Effects of Socs2 knock-down in an MLL-AF9 driven mouse model of AML. (A) Socs2 mRNA levels in MLL-AF9+ BM LCs and in BM and spleen cells of healthy mice were determined by qRT-PCR and normalised to those of the housekeeping gene ß-2-microglobulin using the ∆∆CT method. Mean ± SEM of three independent experiments; ***p < 0.001 (Student’s two-tailed t-test). (B) Left panel, immunoblot analysis for SOCS2 expression in shCtrl or shSocs2 transduced MLL-AF9+ LCs. Right panel, quantification of immunoblot results; mean ± SEM of two independent experiments; *p < 0.05 (Student’s two-tailed t-test). (C) shCtrl or shSocs2 transduced MLL-AF9+ LCs were maintained in suspension culture and counted on the indicated days. Mean ± SEM of three independent experiments. **p < 0.01; ***p < 0.001 (2-way ANOVA followed by Bonferroni’s post-hoc test). (D) Kaplan-Meier plot of mice transplanted with shCtrl or shSocs2 transduced MLL-AF9+ LCs (300.000 Venus+ RFP+ cells per mouse, n = 4). **p < 0.01 (log-rank test). (E–H) Analyses of LCs from mice terminally ill after transplantation with shCtrl or shSocs2 transduced MLL-AF9+ LCs. Mean ± SEM of 3 independent experiments. *p < 0.05, **p < 0.01, ***p < 0.001 (2-way ANOVA followed by Bonferroni’s post-hoc test). (E) Myeloid differentiation of spleen LCs. Mac-1+ Gr-1−, immature LCs; Mac-1+ Gr-1+, mature LCs. (F) Abundance of LSC enriched cells (LSCe; Lin− cKit+ Sca-1− CD34+ CD16/CD32hi cells) among Venus+ RFP+ spleen LCs. (G) Cell cycle distribution of spleen LSCe was determined by Ki67 and DAPI staining. Quiescent cells were defined as Ki67− cells with a 2n DNA content. (H) Colony formation by BM LCs serially plated into methyl cellulose.

