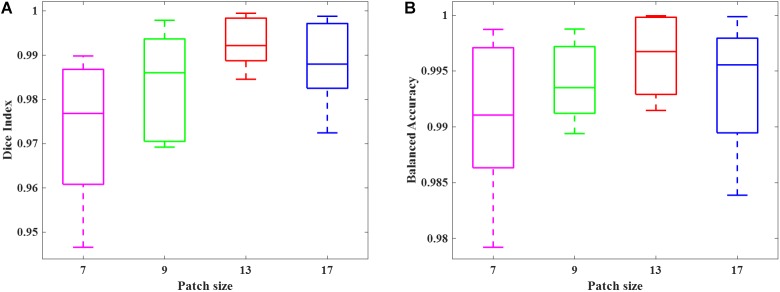
FIGURE 3.
Box plots of the DWMA detection performance, including (A) Dice index and (B) balanced accuracy using four different deep CNN architectures tested on 10 simulated preterm neonatal brain images. The central line indicates the median, and edges of the box indicate the 25 and 75th percentiles. The whiskers extend to the maximum and minimum values.

