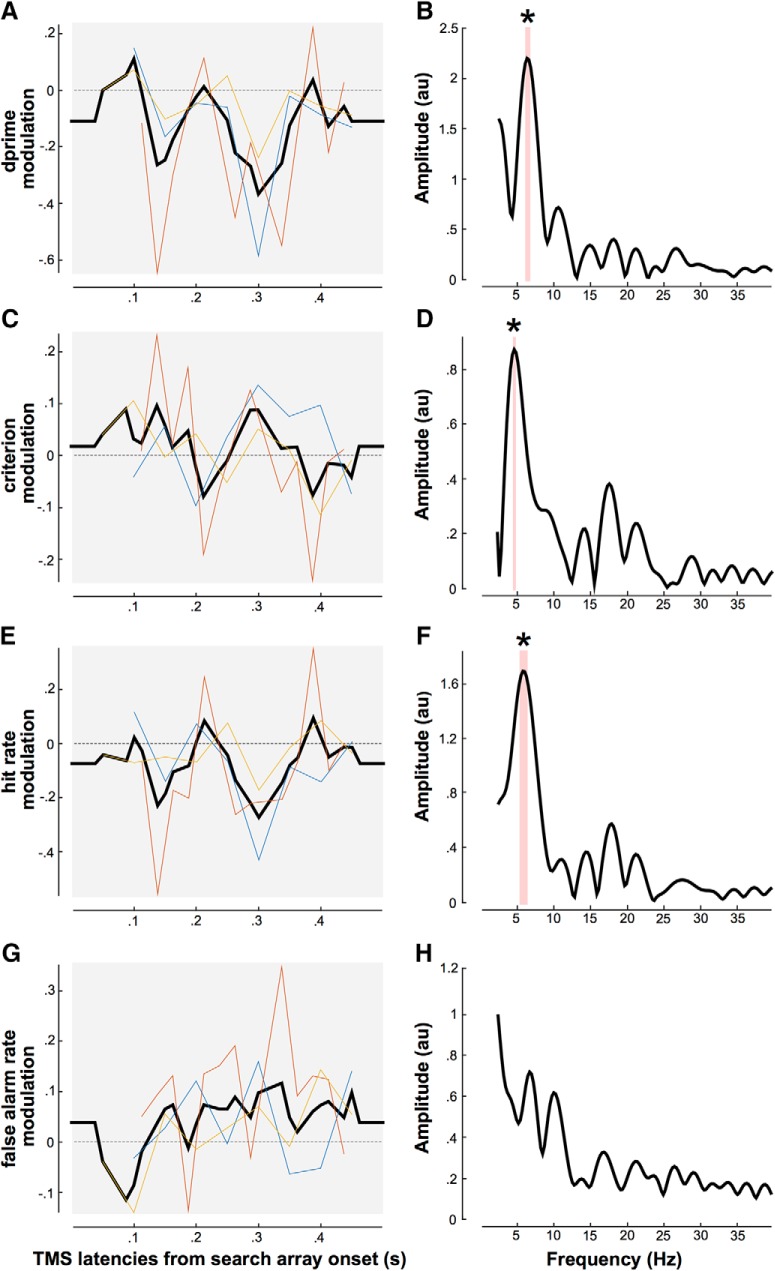
Figure 2.
TMS modulates attentional search periodically. A, D′ modulations (test–control condition) are represented as a function of TMS latencies from the search array onset. The color lines represent each individual study [yellow, current FEF study; blue, first V1 study (Dugué et al., 2011); red, second V1 study (Dugué et al., 2015a)]. The black line is the average across all three studies. B, Amplitude spectrum obtained by FFT decomposition of the averaged data across the three studies. The red shaded area represents the significant spectral components and the *peak at 6.3 Hz (p < 0.05). C, E, G, represent criterion, hit rates, and false-alarm rates modulations, respectively (same representation as in A). D, F, H, represent their corresponding amplitude spectra. The red shaded area represents the significant spectral components and the *peaks at 6 Hz and 18 Hz for criterion and 5.8 Hz for hit rates (p < 0.05).

