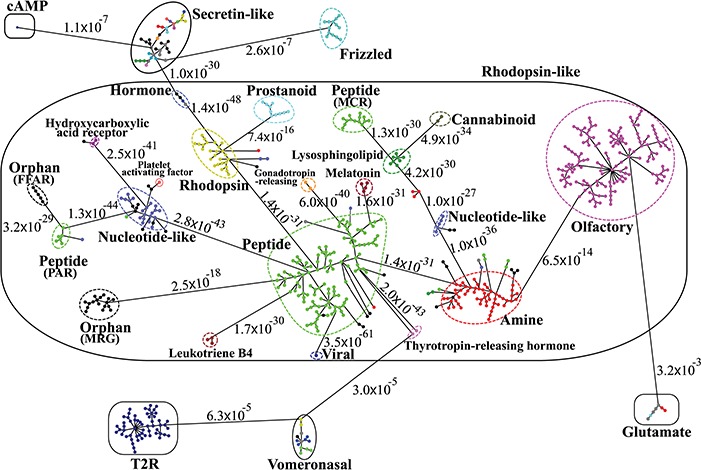
Figure 4.

Minimum spanning tree diagram of the GPCR network in the dataset GPCR2841 (outliers not shown). Each circle represents an MSC cluster, which is colored according to the functions of its constituents. The lengths of the edges are not proportional to their distances, but the distances between subfamilies and classes are labeled to visualize their sequence similarities.
