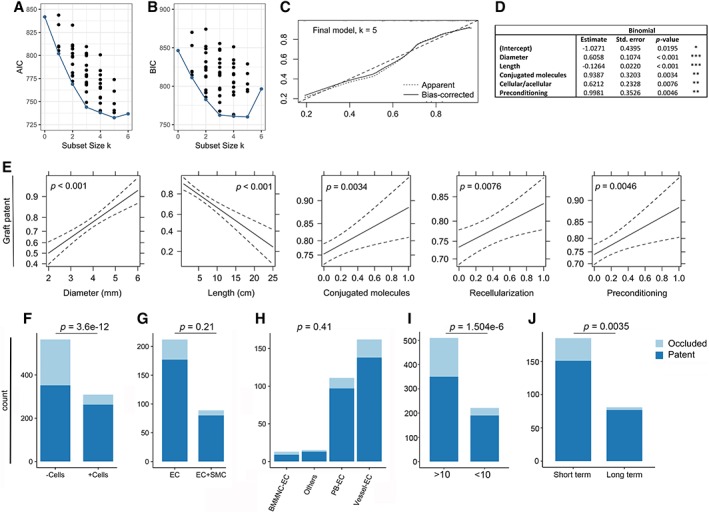
Figure 3.

Binary logistic regression and exploratory data analysis. (A, B): The Akaike information criterion and the Bayesian information criterion for each of the 64 potential models are plotted according to number of explanatory variables (k). The “best” model for each subset size k is marked in red. (C): Bootstrap overfitting‐corrected lowest nonparametric calibration curve for the final model. (D): Final model. Signif. codes: “***” 0.001, “**” 0.01, “*” 0.05, “.” 0.1, “ ” 1. (E): Effects computed from the final model. In order to preserve the linear structure of the model while allowing for interpretation on a familiar scale, the effects are plotted on the scale of the linear predictor of explanatory variables, whereas the vertical axis is labeled on the scale of the dependent variable (i.e., the probability scale). Dotted lines indicate standard error. Association between patency at the time of follow‐up and (F) recellularization of the graft, (G) endothelial cells only, or endothelial cells and smooth muscle cells in combination seeded on the graft, (H) endothelial cell origin, (I) the length/diameter ratio, and (J) the duration of recellularization. The indicated p‐values computed by Monte Carlo simulation are from Pearson's chi‐squared test.
